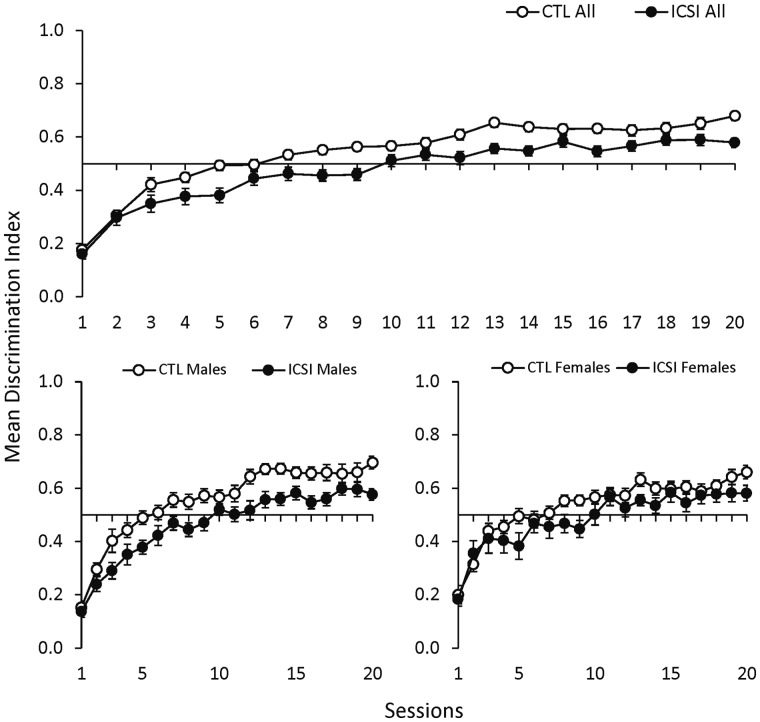
Figure 3.
Discrimination performance during switching discrimination task sessions with mice. Mean discrimination index scores (±SEM) during switching discrimination task (SDT) sessions for all ICSI (n = 36) and CTL (n = 37) mice in the top graph and separated by ICSI and CTL males (ICSI n = 18; CTL n = 19) and females (ICSI n = 18; CTL n = 18) in the bottom graph.

