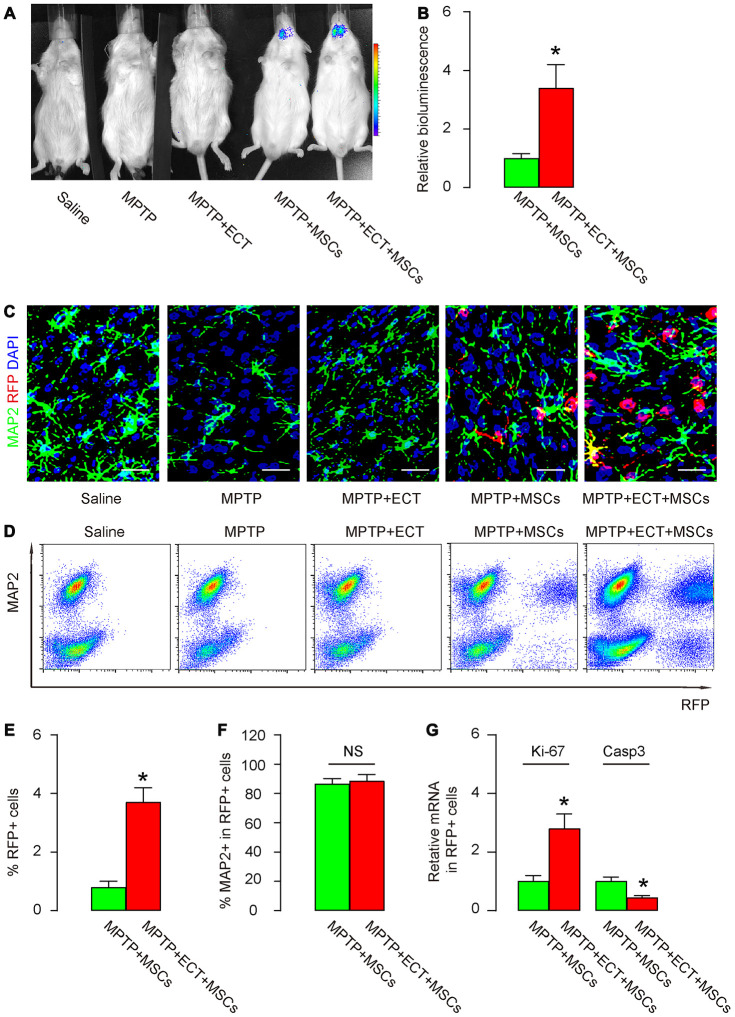
Figure 4.
ECT increases proliferation and survival of grafted MSCs. (A, B) Bioluminescence test for detecting grafted MSCs in mice two months after treatment, shown by representative images (A) and by quantification (B). (C) Representative immunohistochemical images for MAP2 and RFP in mouse brain two months after treatment. (D) Representative flow charts for MAP2 and RFP for mouse brain cells two months after treatment. (E) Quantification of percentage of RFP+ cells in total cells. (F) Quantification of percentage of MAP2+ cells in total RFP+ cells. (G) RT-qPCR for Ki-67 and Casp3 in total RFP+ cells. *p<0.05. NS: non-significant. N=10. Scale bars are 20μm.

