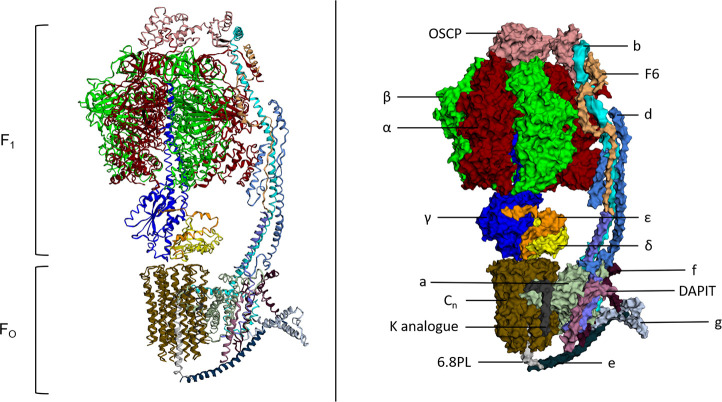
Figure 1.
Atomic structure and labelled space fill model of ATP Synthase (S. scrofa). FO and F1 components of the complex both labelled. Individual subunits labelled on the space fill model. This figure was created using image 6J5J from PDB (http://doi.org/10.2210/pdb6J5J/pdb https://www.rcsb.org/structure/6J5J) and processed using http://www.sbg.bio.ic.ac.uk/ezmol/.

