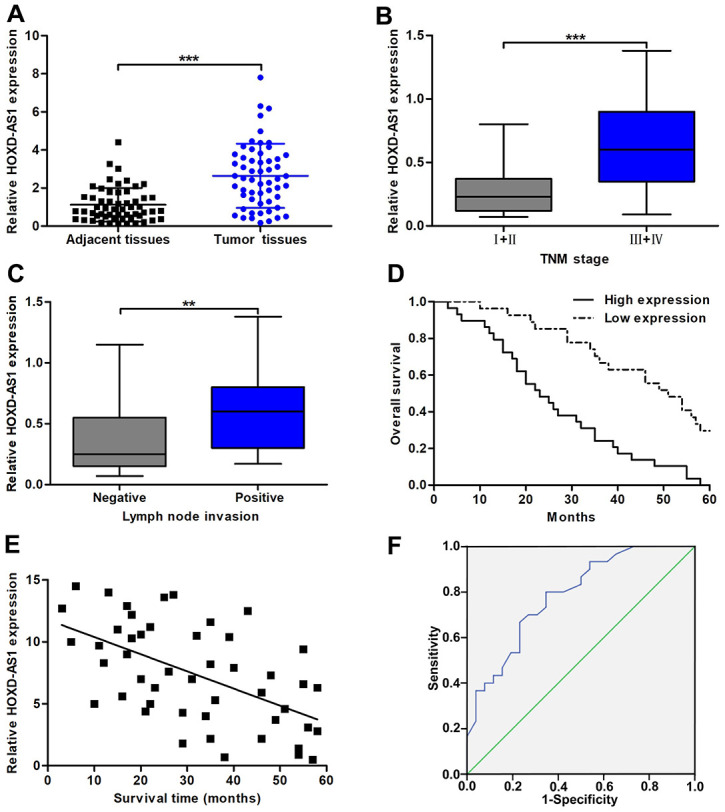
Figure 1.

The expression of HOXD-AS1 and its correlation with clinicopathological characteristics and prognosis. (A) HOXD-AS1 expression in CCA tissues and paired adjacent nontumor bile duct tissues was detected by qRT-PCR. (B) HOXD-AS1 expression in tissues at TNM I+II stage and TNM III+IV stage was detected by qRT-PCR. (C) HOXD-AS1 expression in tissues with lymph node invasion and without lymph node invasion was detected by qRT-PCR. (D) CCA patients were divided into two groups according to average value of HOXD-AS1 expression. Overall survival was evaluated between high and low HOXD-AS1 expression groups by using Kaplan-Meier method and log-rank test. (E) The correlation between relative HOXD-AS1 expression and survival time of CCA patients was assessed by Pearson correlation analysis. (F) The sensitivity and specificity of HOXD-AS1 as a prognostic marker were analyzed by ROC curve. **P < 0.01, ***P < 0.001.
