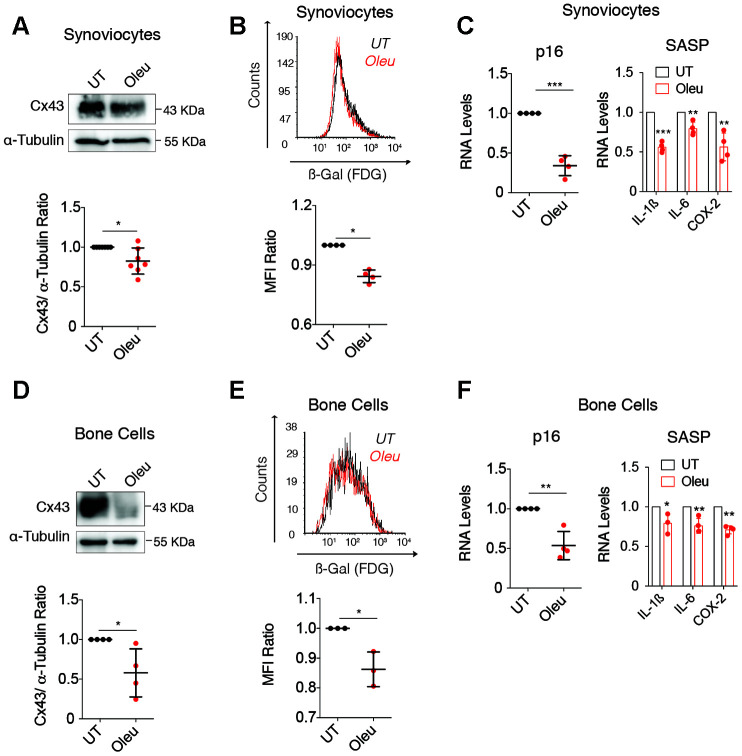
Figure 6.
Oleuropein treatment decreased cellular senescence in synoviocytes and bone cells isolated from patients. (A) Cx43 protein levels analyzed by western blot in synoviocytes treated with 10 μM oleuropein for 2 h (n=7 independent experiments, P=0.0313). (B) Treatment of synoviocytes with 10 μM of oleuropein for 7 days detected by SA-βGal activity (n=4 independent experiments, P<0.0001). (C) p16 mRNA levels of synoviocytes treated with 10 μM oleuropein for 2 h. Data were normalized to HPRT-1 levels (n= 4 independent experiments, P<0.0001). On the right, mRNA levels of IL-1ß, IL-6 and COX-2 of synoviocytes cultured in normal medium (DMEM 10% FBS) and exposed to 10 μM oleuropein for 2 h. Data were normalized to HPRT-1 levels. N=4 independent experiments, P<0.0001 (IL-1ß), P=0.0024 (IL-6), P=0.0025 (COX-2). (D) Cx43 protein levels analyzed by western blot in bone cells treated with 10 μM oleuropein for 2 h (n=4 independent experiments, P=0.0319). (E) 10 μM of oleuropein treatment for 7 days reduces senescence levels in bone cells as detected by SA-βGal and flow cytometry (n=3 independent experiments, P=0.0149). (F) p16 mRNA expression of bone cells treated with 10 μM oleuropein for 2 h. Data were normalized to HPRT-1 levels (n= 4 independent experiments, P=0.002). On the right, mRNA levels of IL-1ß, IL-6 and COX-2 of bone cells cultured in normal medium (DMEM 10% FBS) exposed to 10 μM oleuropein for 2 h. Data were normalized to HPRT-1 levels. N=3-4 independent experiments. P=0.0463 (IL-1ß), P=0.0077 (IL-6), P=0.0002 (COX-2). Data is expressed as mean±SD, Student’s t test; *P<0.05, **P<0.01 and ***P<0.0001.

