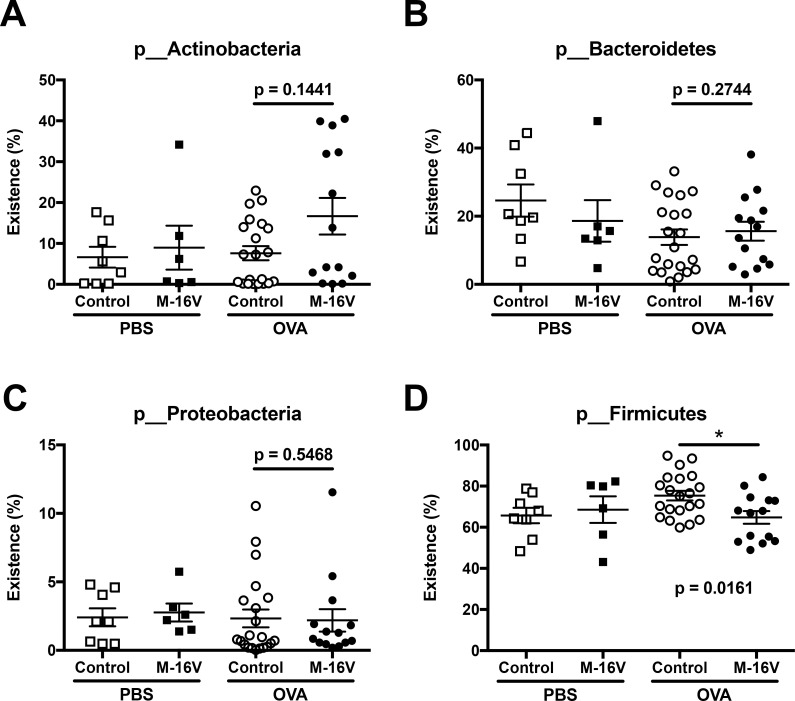
Fig 5. Proportion of total bacteria species in feces between control and B. breve M-16V diet groups.
The abundances of (A) Actinobacteria, (B) Bacteroides, (C) Proteobacteria, and (D) Firmicutes in fecal samples from each mouse were analyzed by 16S rRNA gene sequencing. The values are presented as the means ± SEM (n = 6–21). *P < 0.05 compared between control and B. breve M-16V diet OVA-allergic model mice.

