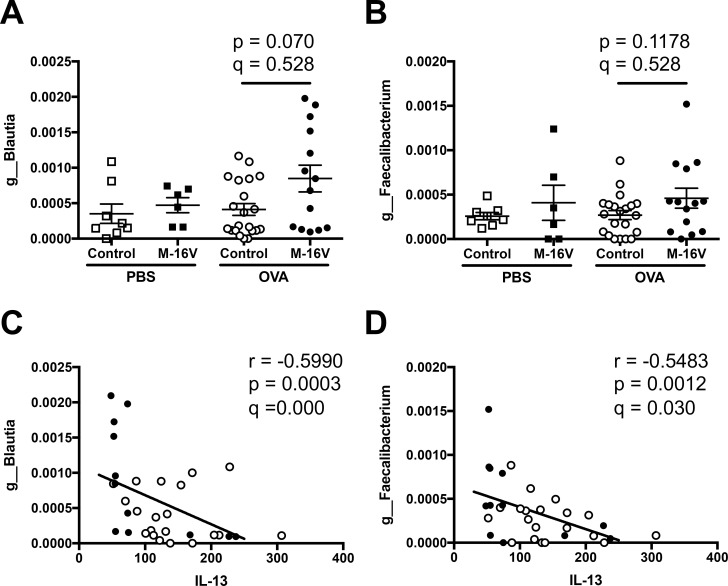
Fig 8. Relationship between IL-13 expression in the lungs and fecal microbiota composition of each sample.
Relative abundance of (A) g_Blautia and (B) g_Faecalibacterium in samples from individual mice. The values are presented as the means ± SEM (n = 6–21). *P < 0.05 compared between control and B. breve M-16V diet OVA-allergic model mice. Spearman’s rank correlation between the relative abundance of (C) g_Blautia or (D) g_Faecalibacterium and IL-13 mRNA expression shown in Fig 3C. Q-value is an FDR adjusted p-value.

