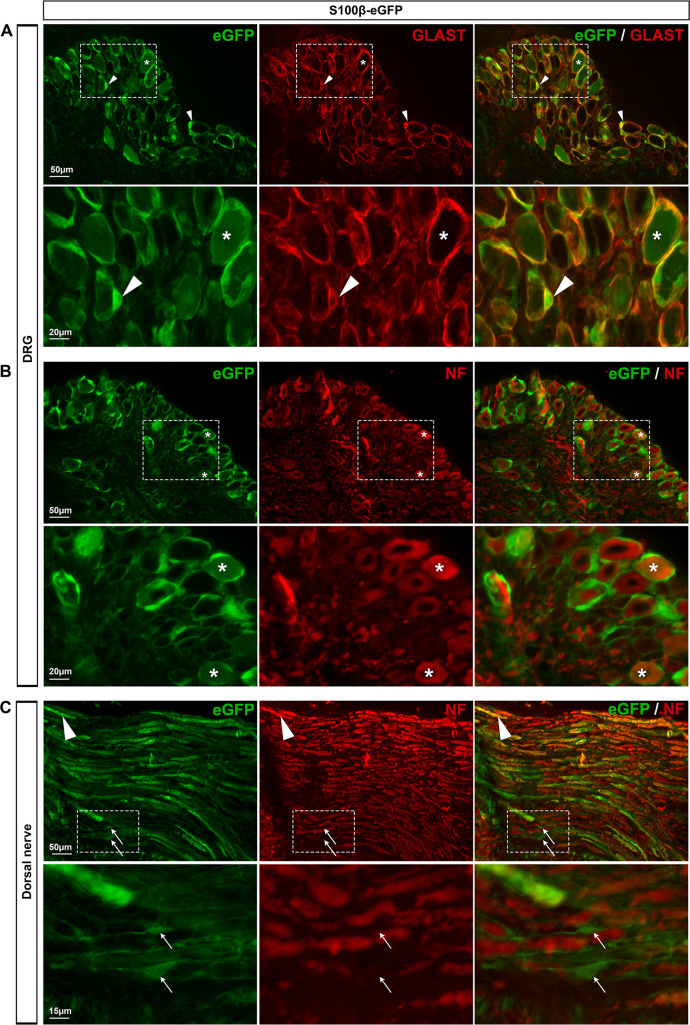
Fig 2. Expression of eGFP in S100β-eGFP mouse DRGs.
A, B, Representative images of immunohistochemistry in DRGs from S100β-eGFP mice showing eGFP-expressing cells (A-C left, green), GLAST-expressing SGCs (A middle, red, arrowheads), and neurofilament-expressing neurons (B middle, red, asterisks). C, Images of proximal DRG nerves showing eGFP staining (C left, green), non-myelinating Schwann cells (C left, arrows) and neurofilament-expressing axons (C middle, arrowheads). A-C right show superimposed pictures. In A-C, bottom panel images correspond to enlargements of boxed areas in top panel images. For each row, scale bar in left picture applies to middle and right corresponding pictures.

