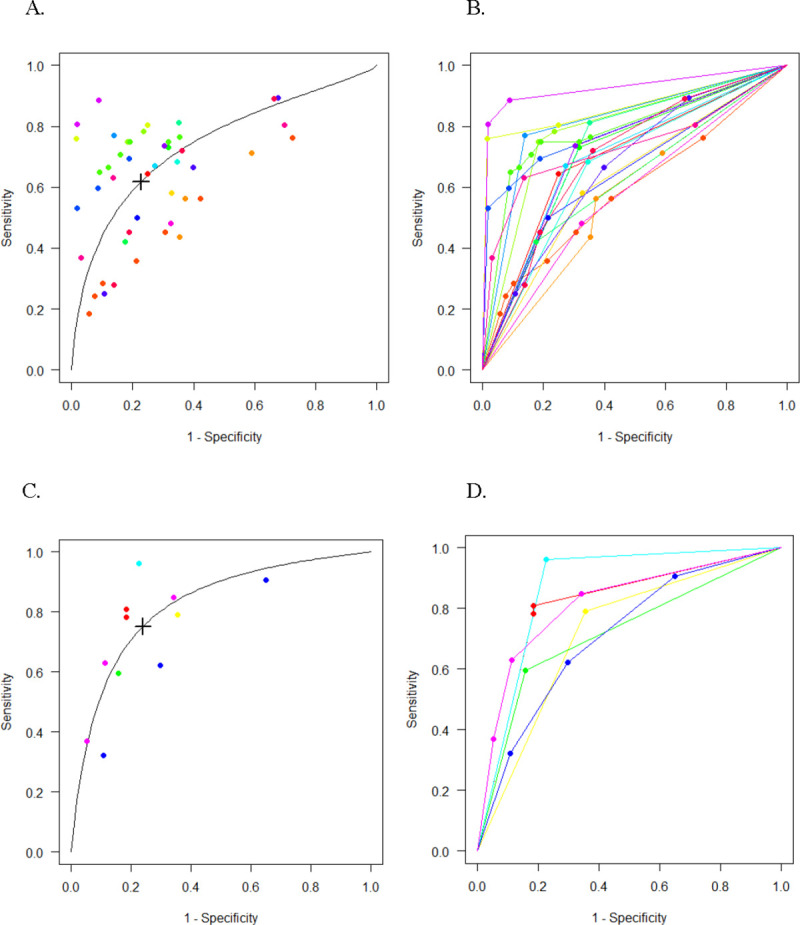
Fig 2. Multiple threshold SROC and ROC curves for detecting NASH.

Multiple threshold SROC and ROC curves for CK-18 M30 (A-B) and M65 (C-D) in detecting NASH. Each point represents a reported threshold value, points of the same color represent thresholds reported within the same study. The x-axis indicates 1 –specificity, and the y-axis, sensitivity. The cross in the SROC curve indicates the Youden-based threshold value: A. Youden-threshold: 304 U/L, sensitivity: 0.61 (95% CI: 0.51–0.71), specificity: 0.81 (95% CI: 0.71–0.88), AUC: 0.75 (95% CI: 0.69–0.82) for CK-18 M30. C. Youden-threshold: 478 U/L, sensitivity: 0.75 (95% CI: 0.51–0.90), specificity: 0.76 (95% CI: 0.49–0.91), AUC: 0.82 (95% CI: 0.69–0.91) for CK-18 M65.
