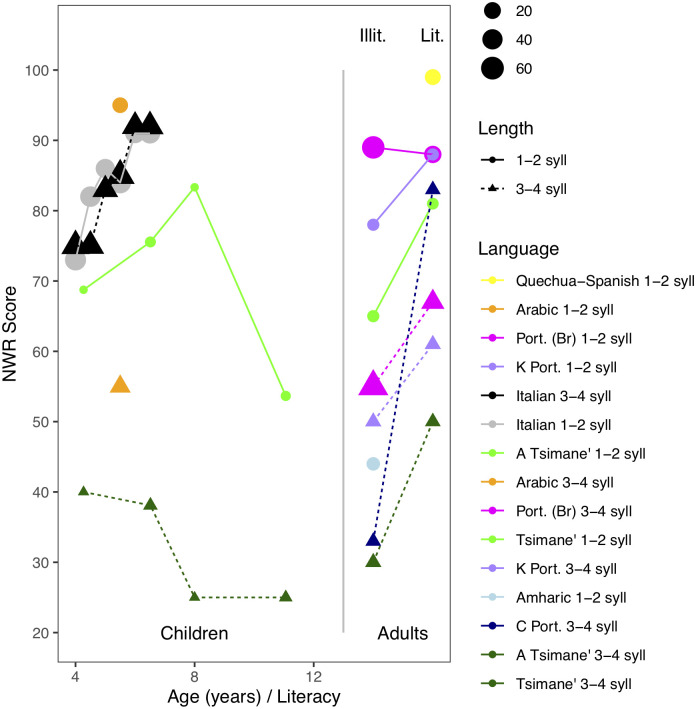
Fig 4. NWR scores in previous and current work, splitting by participant age, non-word length, and literacy (among adults).
Study legend is sorted from highest to lowest average to facilitate linking. The size of the circle indicates sample size. Among Portuguese-speaking adults from Portugal, we separate results by study: K = [52]; C = [55].

