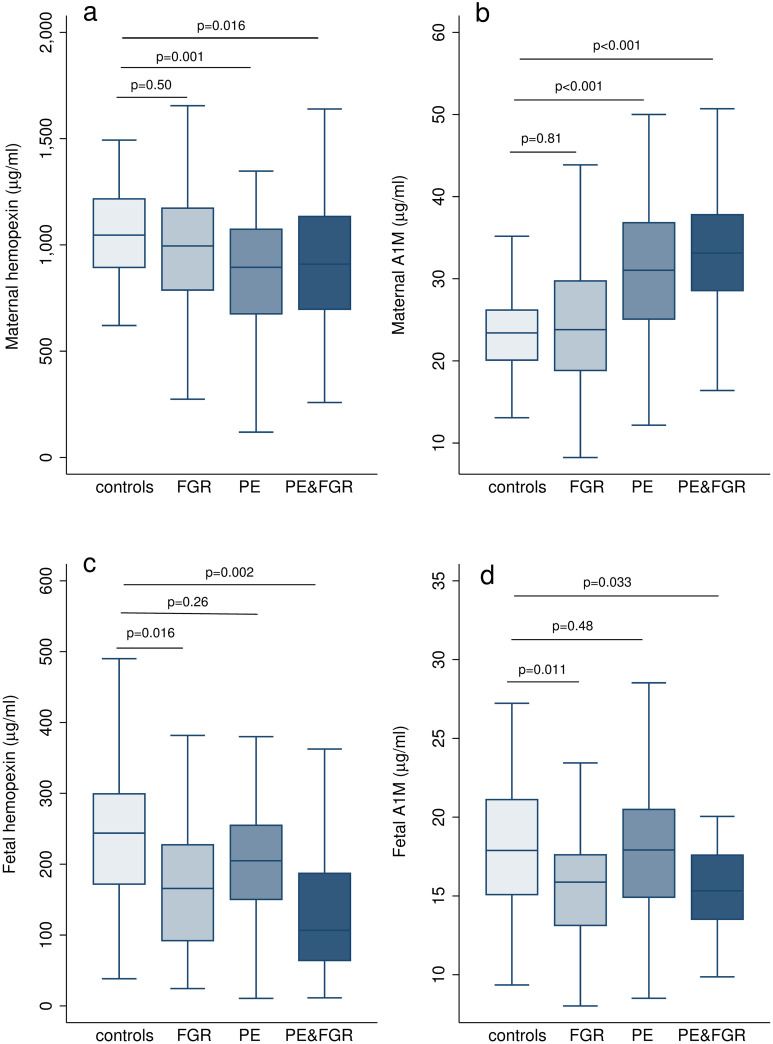
Fig 2. Concentrations of heme scavengers in maternal and fetal blood in the study population.
Box plots represent a) maternal hemopexin concentrations, b) maternal A1M concentrations, c) fetal hemopexin concentrations, d) fetal A1M concentrations. Boxes show median and interquartile range, whiskers represent 1.5 Χ interquartile range or the extremes of the distribution. FGR, fetal growth restriction; PE, preeclampsia; A1M, α1-microglobulin. p values were calculated by multiple regression (multivariate linear regression) compared to controls, adjusted for chronic hypertension, diabetes, assisted reproductive technologies, smoking, fetal sex and gestational age at sampling.

