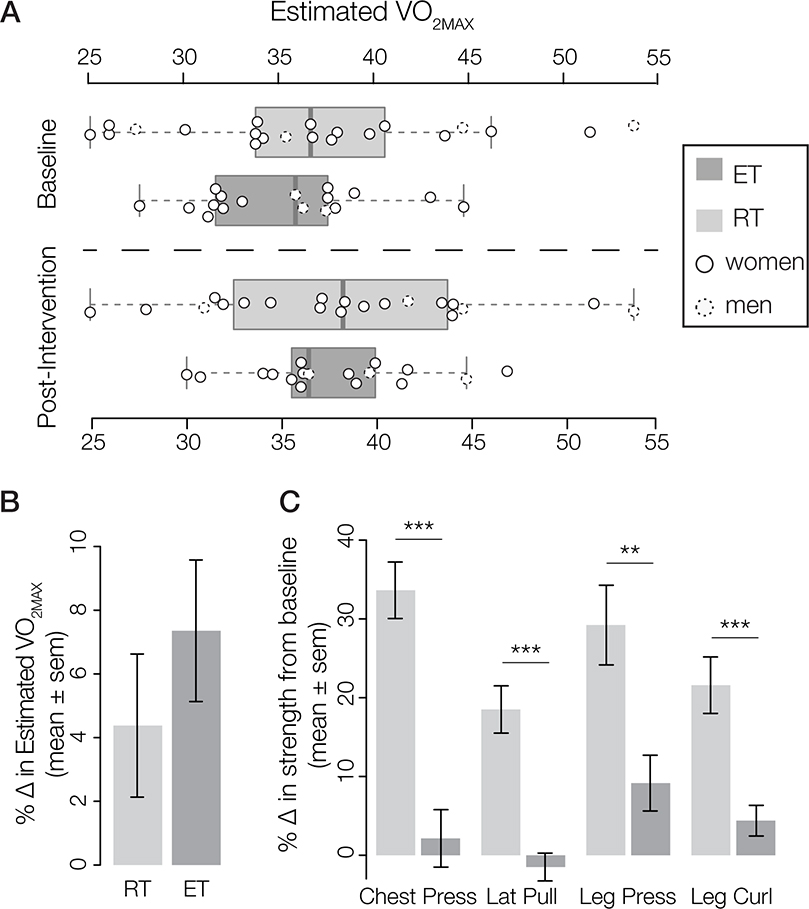
Figure 2. Fitness Results.
(A) Boxplots showing estimated , the measure of cardiorespiratory fitness (CRF) for each exercise group (ET and RT) at baseline fitness test (top) and post-intervention testing (bottom). Individual data points are overlain (closed circle – women; dotted circle – men). (B) Change in CRF for the RT and ET exercise groups. Within-group t-tests show that only the ET group had a significant increase in CRF; group comparison in repeated measures-ANOVA do not show significantly different changes at the group level. (C) Increases in strength from baseline, measured by the percent change from baseline (lbs) for each exercise across the groups. The RT group showed significantly greater improvements compared to the ET group for each exercise (***p < 0.0001; ** p < 0.001). N (ET) = 17; N (RT) = 21.

