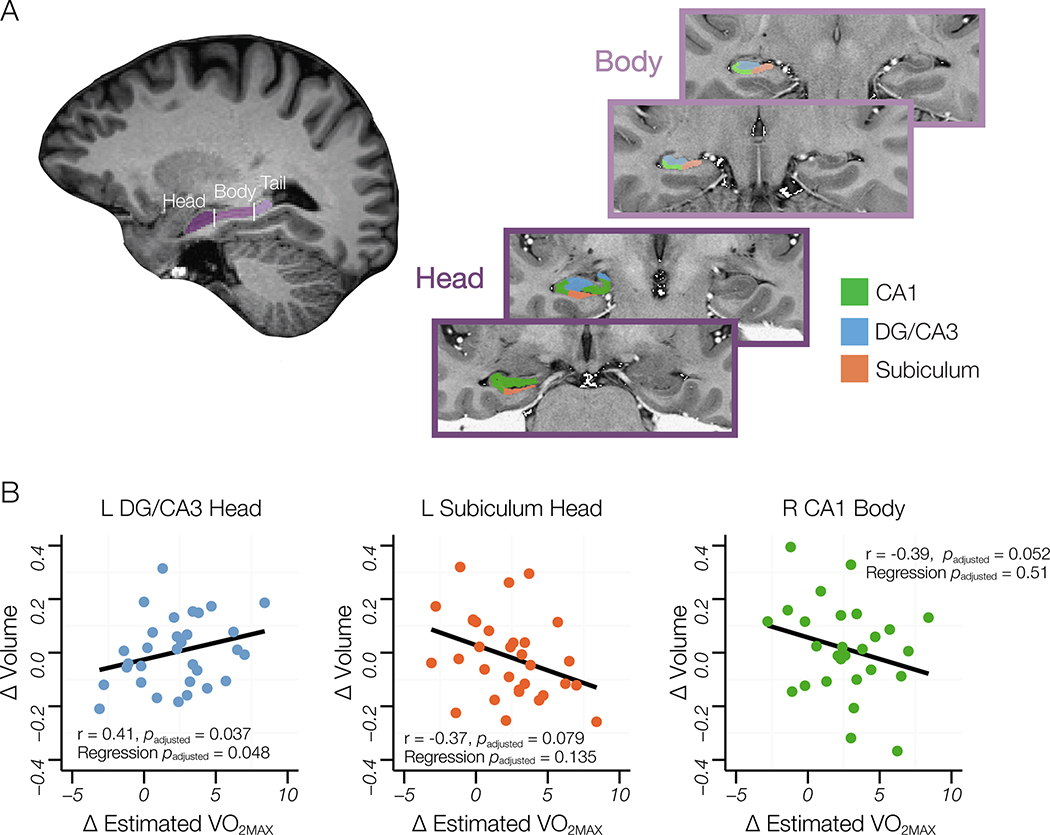
Figure 3. Delineations of Regions of Interest (ROI) and relationships between changes in CRF and hippocampal subfield volume.
(A) ROIs for hippocampal subfield segmentation were manually traced and included CA1, DG/CA3 and subiculum in the head and body. Head, body, and tail separations were decided by anatomical landmarks (see text). Hippocampal tail was not segmented into subfields. (B) Scatterplots of the association between change in CRF and subfield volumes. There was a significant positive relationship between change in CRF and change in adjusted volume in the head of the DG/CA3 (B, left), and a negative relationship between change in CRF and adjusted volume in left head of the subiculum (B, middle) and adjusted volume in the body of right CA1. Subsequent multiple regression models including covariates mitigated the relationships between change in CRF and volume in the left head of the subiculum and right body of CA1, but the positive relationship between change in CRF and volume in the left head of DG/CA3 remained (B, left).

