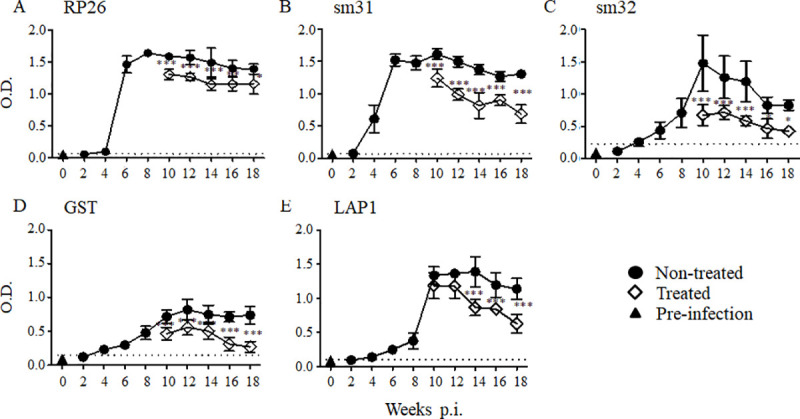
Fig 1. IgG responses to the S. mansoni antigens during S. mansoni infection and after the treatment.

In each group, five mice were infected with 50 S. mansoni cercariae, and the sera were collected at each time point. A group of mice was orally treated twice with 500 mg/kg PZQ at 8 weeks post-infection. The experiment was repeated for 3 times and the representative data are presented. The means of the IgG level to the S. mansoni recombinant RP26 (A), sm31 (B), sm32 (C), GST (D), and LAP1 (E) are shown with the standard errors. The dashed line represents the cut-off value (mean + 3SD of the OD of the pre-infected group). The IgG levels of the treated group (open diamonds) are compared with those of the untreated group (closed circles) and with those of pre-infection samples taken at week 0 (closed triangles). *p < 0.05, **p < 0.01, and ***p < 0.001.
