

Abstract
Background
The correlation between the infection of H. pylori and the occurrence of gastric MALT lymphoma (GML) has been well documented. However, the mechanism of how GML is caused by this bacterium is not well understood, although some immunologic mechanisms are thought to be involved.
Materials and methods
In this study, we performed both transcriptomic and proteomic analyses on gastric cancer cells infected by H. pylori isolates from GML patients and the gastric ulcer strain 26695 to investigate the differentially expressed molecular signatures that were induced by GML isolates.
Results
Transcriptomic analyses revealed that the differentially expressed genes (DEGs) were mainly related to binding, catalytic activity, signal transducer activity, molecular transducer activity, nucleic acid binding transcription factor activity, and molecular function regulator. Fifteen pathways, including the Wnt signaling pathway, the mTOR signaling pathway, the NOD-like receptor signaling pathway and the Hippo signaling pathway, were revealed to be related to GML isolates. Proteomic analyses results showed that there were 116 differentially expressed proteins (DEPs). Most of these DEPs were associated with cancer, and 29 have been used as biomarkers for cancer diagnosis. We also found 63 upstream regulators that can inhibit or activate the expression of the DEPs. Combining the proteomic and transcriptomic analyses revealed 12 common pathways. This study provides novel insights into H. pylori-associated GML. The DEPs we found may be good candidates for GML diagnosis and treatment.
Conclusions
This study revealed specific pathways related to GML and potential biomarkers for GML diagnosis.
Introduction
Helicobacter pylori (H. pylori) is a spiral-shaped gram-negative bacterium that resides between the gastric epithelium and the protective mucosal barrier lining the stomach. Through adaptive mechanisms, H. pylori can buffer the acidic gastric environment and survive in the stomach of approximately 50% of people worldwide. H. pylori infection is now considered a major cause of chronic gastritis, peptic ulcer disease, gastric adenocarcinoma and gastric MALT lymphoma (GML). GML is the most common marginal zone lymphoma of the digestive tract. The involvement of H. pylori in the occurrence of GML has been well established. A link between H. pylori and GML was found in many studies by identifying the bacteria in the vast majority of GML patients [1–3]. At the same time, eradication of H. pylori infection in patients with early stage of MALT lymphoma has resulted in complete remission of the disease [4]. As a result, H. pylori eradication therapy is now considered the first therapeutic approach for low-grade GML [5].
The pathogenesis of GML caused by this bacterium is not well understood, although some immunologic mechanisms are thought to be involved [6, 7]. As a chronic antigen stimulation, the persistence of H. pylori colonization results in the recruitment of immune lymphocytes that migrate to and infiltrate the site of H. pylori infection in the stomach, leading to the loss of the regulation of B-lymphocyte proliferation and differentiation [7]. Studies have also been performed to identify virulence factors or genetic markers of H. pylori strains associated with GML. Whole-genome comparisons showed that H. pylori strains isolated from patients with GML are different from those isolated from gastritis and ulcers [8]. Other studies showed that the occurrence of GML may be associated with the virulence factors of H. pylori, including CagA, VacA and adhesins [9–11]. However, how these virulence factors and GML-associated isolates contribute to gastric lymphomagenesis remains unknown.
Investigating the gene expression of host cells infected by H. pylori may provide information needed to analyze the biological processes induced by H. pylori infection. The transcription profiles of gastric epithelial and gastric cancer cell lines stimulated with different H. pylori isolates and the in vivo gene expression in human gastric tissue have been examined by many groups of investigators [12–15], whereas studies examining the gene expression pattern in human gastric cancer cell lines infected with H. pylori isolates from GML are still limited. In this study, we compared the transcriptome and proteome of the gastric cancer cell line BGC823 infected by H. pylori isolates from GML patients and the gastric ulcer strain 26695. We identified key gene transcription and expression profiles that were induced by GML isolates, which may provide further insights into the mechanism and diagnosis of GML.
Materials and methods
H. pylori infection of gastric cancer cells
Two H. pylori strains H879 and MALT1 were isolated from GML patients. The study was approved by the ethics committee of Chinese Center for Disease Control and Prevention and follows the tenants of the Declaration of Helsinki. Statement on informed consent were obtained from the respective individuals. The two GML strains both have cagA, vacA, babA and oipA genes. The two GML strains and strain 26695 were cultured routinely on Columbia agar plates supplemented with 5% sheep blood in mixed air containing 10% CO2, 5% O2 and 85% N2 at 37°C. H. pylori were harvested and resuspended in sterile phosphate-buffered saline (PBS). To test the transcriptome of human gastric cell lines stimulated with H. pylori, we selected two commonly used cell lines BGC823 (a human gastric carcinoma undifferentiated cell line) and GES-1 (a human normal gastric epithelial cell line). The cell lines were cultured in RPMI 1640 supplemented with 10% FBS at 37°C in an atmosphere of 5% CO2. The cells were washed with PBS three times and then infected with H. pylori at an MOI of 100 [16]. After 4 h, the cells were washed, harvested, and total RNA and proteins were extracted for transcriptomic and proteomic assays.
Protein extraction, digestion, TMT labeling and analysis by nano-HPLC-MS/MS
Protein extraction
The harvested cells were lysed by 8 M urea in 50 mM triethyl ammonium bicarbonate (TEAB) with ultrasonic breakage for 20 seconds. The protein samples were collected by centrifugation at 16,000×g for 10 minutes at 4°C. Protein concentration was determined with the BCA Protein Assay kit (Thermo-Fisher Scientific).
Digestion and purification
One hundred micrograms of protein were reduced by incubation with 200 mM TCEP at 55°C for 1 hour and then alkylated by incubation with 375 mM iodoacetamide (IAA) (Thermo Scientific) for 30 min. Proteins were digested with trypsin (Promega) at a trypsin/protein ratio of 1:50(w/w) overnight at 37°C.The resulting tryptic peptides were dried by speed vacuum at 4°C and desalted with a C18 spin column (Thermo Scientific) according to the manufacturer's protocol.
Tandem mass tag(TMT) labeling
The dried and desalted peptides were labeled by TMT Label Reagents (Thermo Scientific USA) according to the manufacturer’s protocol [17]. The resultant peptide mixture was labeled with TMT reagent as follows: ATCC26695-126 isobaric tag, H879-127 isobaric tag and MALT1-128 isobaric tag.
Nano-HPLC-MS/MS analysis
The samples were reconstituted in 0.1% formic acid (FA) and separated on a nanoAcquity Ultra Performance Liquid Chromatography (UPLC) EASY-nLC 1000 system (Thermo Scientific), fitted with a nanoAcquity Symmetry C18 Trap Column (100 μm×2 cm, nanoViper C18, 5 μm, 100 Å) and an analytical column (75 μm×15 cm, nanoViper C18, 3 μm, 100 Å). Mobile phase A was 100:0.1 HPLC grade water/FA, and mobile phase B was 100:0.1 ACN/FA. Each sample was loaded on the trapping column at a 2.0 μL/min flow rate and then separated on the analytical column using a 100 min 3–35% mobile phase B linear gradient at a 0.8 μL/min flow rate. Retention Time Calibration Mixture (Thermo Scientific) was used to optimize LC and MS parameters and was used to monitor the stability of the system.
The analytical column was coupled to a high-resolution Q-Exactive Plus mass spectrometer (Thermo Fisher Scientific, San Jose, CA) using a nanoelectrospray ion source operated in positive ion mode. The source was operated at 2.0 kV with transfer-capillary temperature maintained at 250°C and S-Lens RF level set at 60. MS spectra were obtained by scanning over the range m/z 350–2000. Mass spectra were acquired in the Orbitrap mass analyzer with 1 micro scan per spectrum for both MS and MS/MS. The resolving power for MS and MS/MS were set at 70,000 and 17,500, respectively. Tandem MS data were acquired in parallel with MS, on the top 20 most abundant multiply charged precursors, with higher energy collisional dissociation (HCD) at a normalized collision energy of 30 V. Precursors were isolated using a 2.0 m/z window, and dynamic exclusion of 60 s was enabled during precursor selection. TMT data acquisition was repeatedly detected two times for each sample. TMT labeling can only compare the expression levels of the proteins in different groups. In this context, we also used label-free method to analyze all the samples and to detect proteins that were only present in a specific group. The digested and purified samples were acquired three times for label-free analysis. For these repetitive data, we take the values that appear in each repetition for analysis.
Protein identification and quantitative analysis
Proteome Discoverer (version 1.4, Thermo Scientific, USA) was used to search the UniProtKB/Swiss-Prot database. The parameters were set as follows: integration tolerance 20 ppm, precursor mass tolerance 10 ppm, fragment mass tolerance 0.02 Da, Dynamic modification Oxidation/+15.99 Da and carbamidomethyl/+57.02 Da were set as dynamic and static modifications. Differentially expressed proteins were determined by peptide identifications with 95% confidence intervals; moreover, TMT signal analyses showed at least a twofold change in abundance, and its p value was <0.05 in unpaired Student’s t test. The specific DEPs were obtained by PEAKS Studio (version 8.0).
Ingenuity Pathway Analysis
The commercial software Ingenuity IPA system (Ingenuity Systems, Redwood City, CA, USA; http://www.ingenuity.com) was used in the analysis of the DEPs. The diseases & functions and upstream & downstream regulatory factors (the species selection: Human) of these proteins were analyzed by the BUILD function of IPA. The Overlay tool was used to analyze the canonical pathway and biomarker information of these proteins using default parameters.
Nuclear RNA extraction and sequencing
Total RNA was extracted using Trizol (Invitrogen, Carlsbad, CA, USA). RNA with an RNA integrity number > 8 according to the 2100 Bioanalyzer (Agilent, USA) was used to prepare cDNA libraries with the Illumina TruSeq Stranded Total RNA Library Prep Kit (Illumina, San Diego, CA, USA). Oligo (dT) magnetic beads were used to select mRNA with polyA tail. The resulting libraries were sequenced on a HiSeq2000 platform (Illumina).
Processing of sequence data and mapping reads to the reference genome
The sequenced data were filtered by removing adaptor sequences, reads in which unknown bases are more than 10%, and low quality reads (the percentage of low quality bases is over 50% in a read, we defined a low quality base asa base whose sequencing quality is no more than 5).We used Bowtie2 [18] to map clean reads to the reference gene and used HISAT [19] to map reads to the reference genome hg19. The FPKM method was used to calculate the expression level, and the following formula:
Given the expression of gene A, C is the number of fragments that are aligned to gene A, N is the total number of fragments that are aligned to all genes, and L is the number of bases in gene A. The FPKM method can eliminate the influence of different gene lengths and sequencing discrepancies on the calculation of gene expression. Therefore, the calculated gene expression can be directly used for comparing the differences in gene expression among samples. Referring to "The significance of digital gene expression profiles" [20], we have developed a strict algorithm to identify differentially expressed genes between two samples. Denote the number of unambiguous clean tags (which means reads in RNA-Seq) from gene A as x, given every gene's expression occupies only a small part of the library, x yields to the Poisson distribution:
the total clean tag number of the sample 1 is N1, and total clean tag number of sample 2 is N2; gene A holds x tags in sample 1 and y tags in sample 2. The probability of gene A expressed equally between two samples can be calculated with:
We do correction on P-value corresponds to differential gene expression test using bonferroni method [21]. Since DEG analysis generate a large multiplicity problems in which thousands of hypothesis (is gene x differentially expressed between the two groups) are tested simultaneously, correction for false positive (type I errors) and false negative (type II) errors are performed using FDR method [22].
Genes with similar expression patterns usually have same functional correlation. So we perform clustering analysis of differentially expressed genes with cluster [23, 24] and javaTreeview software [25] according to the provided cluster plans for DEGs.
Gene Ontology annotation and KEGG pathway enrichment analyses
GO-Term Finder was used to identify Gene Ontology (GO) terms. We have developed a strict algorithm to do the analysis, and the method used is described as follow:
Where N is the number of all genes with GO annotation; n is the number of DEGs in N; M is the number of all genes that are annotated to certain GO terms; m is the number of DEGs in M. The calculated p-value goes through Bonferroni Correction [21], taking corrected p-value≤0.05 as a threshold. GO terms fulfilling this condition are defined as significantly enriched GO terms in DEGs. This analysis is able to recognize the main biological functions that DEGs exercise. The KEGG pathway enrichment analysis was conducted using the KOBAS2.0 website (http://kobas.cbi.pku.edu.cn/).
Biomarker analysis
The biomarker application analysis of all differential proteins is completed by using the biomarker filter analysis function of IPA software. Parameters are selected for all related human cancers and all body fluids. In the results obtained, click the corresponding application project in the biomarker application project, there will be a large number of corresponding references, which we didn’t listed one by one in the results.
Results
Transcriptomic analyses
Transcriptome of BGC823 cell line and GES-1cell line infected by H. pylori isolates
Since previous studies indicated that H. pylori strains associated with GML are different from others [8], to better understand the differentially transcribed genes related to GML, we selected two H. pylori strains H879 and MALT1 isolated from GML patients, and compared the transcriptome of gastric cell lines infected by these two strains and the gastric ulcer strain 26695. At the same time, we selected two cell lines, human gastric carcinoma undifferentiated cell line BGC823 and human normal gastric epithelial cell line GES-1 for comparison. Eight cDNA libraries of different groups (BGC823, 26695_BGC823, H879_BCG 823, MALT1_BCG 823, GES-1, 26695_GES-1, H879_GES-1, MALT1_GES-1) were constructed and analyzed using RNA-Seq technology. Sequencing of the clean reads resulted in 23–24 million reads per sample. More importantly, all samples had 93–94% of the total reads that mapped to the human genome. Specifically, an average of 17,512, 17,188, 17,179, 17,382, 18496, 18569, 18583, and 18448 genes were identified in the eight libraries, respectively. The results demonstrated a high degree of coverage, a common uniformity in transcriptomic composition, and a lack of overall shifts in transcript levels across samples. We then compared the differentially expressed genes (DEGs) between different pairs. Our results showed that when infected by 26695, H879 or MALT1, for the GES-1 cells and the BGC823 cells, the number of significant DEGs in the BGC823 cells stimulated by the three isolates were much more than that of the GES-1 cells (Table 1), suggesting that BGC823 cell line is much more sensitive to the infection of H.pylori than GES-1 cell line.
Table 1. The number of DEGs, significant DEGs, up-regulated and down-regulated DEGs in different pairs.
| Cell line | Pairs | Number of Up-regulated DEGs | Number of Down-regulated DEGs | Significant DEGs | Non significant DEGs | Total DEGs |
|---|---|---|---|---|---|---|
| GES-1 | 26695_GES-1 vs GES-1 | 26 | 46 | 72 | 19362 | 19434 |
| H879_GES-1 vs GES-1 | 18 | 49 | 67 | 19378 | 19445 | |
| MALT1_GES-1 vs GES-1 | 36 | 97 | 133 | 19252 | 19385 | |
| H879_GES-1 vs 26695_GES-1 | 31 | 28 | 59 | 19413 | 19472 | |
| MALT1_GES-1 vs 26695_GES-1 | 49 | 29 | 78 | 19351 | 19429 | |
| MALT1_GES-1 vs H879_GES-1 | 45 | 30 | 75 | 19353 | 19428 | |
| BGC823 | 26695_ BCG 823 vs BGC823 | 1126 | 352 | 1478 | 16811 | 18289 |
| H879_ BCG 823 vs BCG 823 | 1036 | 1455 | 2491 | 15861 | 18352 | |
| MALT1_ BCG 823 vs BCG 823 | 962 | 1145 | 2107 | 16343 | 18450 | |
| H879_ BCG 823 vs 26695_ BCG 823 | 377 | 1903 | 2280 | 15818 | 18098 | |
| MALT1_ BCG 823 vs 26695_ BCG 823 | 374 | 1430 | 1804 | 16418 | 18222 | |
| MALT1_ BCG 823 vs H879_ BCG 823 | 59 | 36 | 95 | 18081 | 18176 |
The two GML isolates H879 and MALT1 resulted in a similar global expression pattern in BGC823 cell line
We then used BGC823 cell line for further analysis and compared the global expression patterns of BGC823 cell line infected by different H. pylori strains. The differentially expressed genes (DEGs) were defined as genes with an adjusted p-value <0.05 after FDR correction. Our results showed that BGC823 cell line infected by the two GML isolates H879 and MALT1 exhibited similar global expression patterns. There were 1,036 and 962 up-regulated and 1,455 and 1,145 down-regulated DEGs in the two groups H879_ BCG 823 vs BCG 823 and MALT1_ BCG 823 vs BCG 823, respectively. In contrast, when infected by 26695, there were 1,126 up-regulated and only 352 down-regulated DEGs. The number of down-regulated DEGs induced by 26695 was much lower than that induced by the GML isolates (Table 1, Fig 1A and 1B). The volcano plot showed that there was little variation in the gene expression profiles between MALT1_BGC823 and H879_BGC823 (S1A Fig). However, large differences can be seen between MALT1_BGC823 and 26695_BGC823 and between H879_BGC823 and 26695_BGC823 (S1B and S1C Fig). We then performed DEGs foldchange clustering analysis for all DEGs to examine global gene expression patterns among different pairs. As expected, the pattern of down-regulated and up -regulated DEGs of BGC823 cells infected by the two GML isolates were similar and were clustered together and can be easily distinguished from that of 26695 (Fig 1C). We then compared the transcriptome of BGC823 cell line infected by H879 or MALT1 with the transcriptome of BGC823 cell line infected by 26695. There were 1902 down-regulated and 377 up-regulated DEGs in the pair H879_823 vs 26695_823 and 1430 down-regulated and 374 up-regulated DEGs in the pair MALT1_823 vs 26695_823. We consider these DEGs to be specifically induced by GML strains. In contrast, there were only 36 down-regulated and 59 up-regulated DEGs in the pair MALT1_823 vs H879_823.
Fig 1. The number of DEGs in BGC823 cells infected by GML isolates and strain 26695 and clustering results.

A. The number of down-regulated DEGs in BGC823 cell line stimulated with different H. pylori. B. The number of up-regulated DEGs in BGC823 cell line stimulated with different H. pylori strains. The number of down-regulated DEGs induced by 26695 was much lower than that induced by the GML isolates. C. DEGs fold change clustering results of BGC823 cell line stimulated with different H. pylori.
Gene Ontology analysis and pathways of the DEGs induced specifically by GML isolates
To elucidate the roles and functions of the DEGs induced specifically by the GML isolates, Gene Ontology (GO) analyses was performed. The results showed that the highly enriched GO terms were mainly associated with the biological process of cellular process, metabolic process, single-organism process, biological regulation; and the molecular functions were mainly associated with binding, catalytic activity, signal transducer activity, molecular transducer activity, nucleic acid binding transcription factor activity, and molecular function regulator (Fig 2A and 2B). KEGG classification on these DEGs showed that the top classifications were associated with signal transduction, cancers, endocrine system, global and overview maps, infectious diseases, cellular community, and immune system (S2A and S2B Fig). By pathway enrichment, we found fifteen pathways, including the Wnt signaling pathway, mTOR signaling pathway, Hippo signaling pathway and NOD-like receptor signaling pathway,were commonly enriched in H879_BGC823 vs 26695_BGC823 and MALT1_BGC823 vs 26695_BGC823, which were considered to be induced specifically by GML isolates (Fig 3A and 3B). Complete gene lists for the top pathways Wnt signaling, mTOR, NOD-like receptor and Hippo were shown in supplementary data (S1 Table).
Fig 2. GO analysis of the DEGs induced specifically by GML isolates.

A. GO analysis of the DEGs in H879_BGC823 vs 26695_BGC823. B. GO analysis of the DEGs in MALT1_BGC823 vs 26695_BGC823.
Fig 3. KEGG pathway enrichment of the DEGs induced specifically by GML isolates.
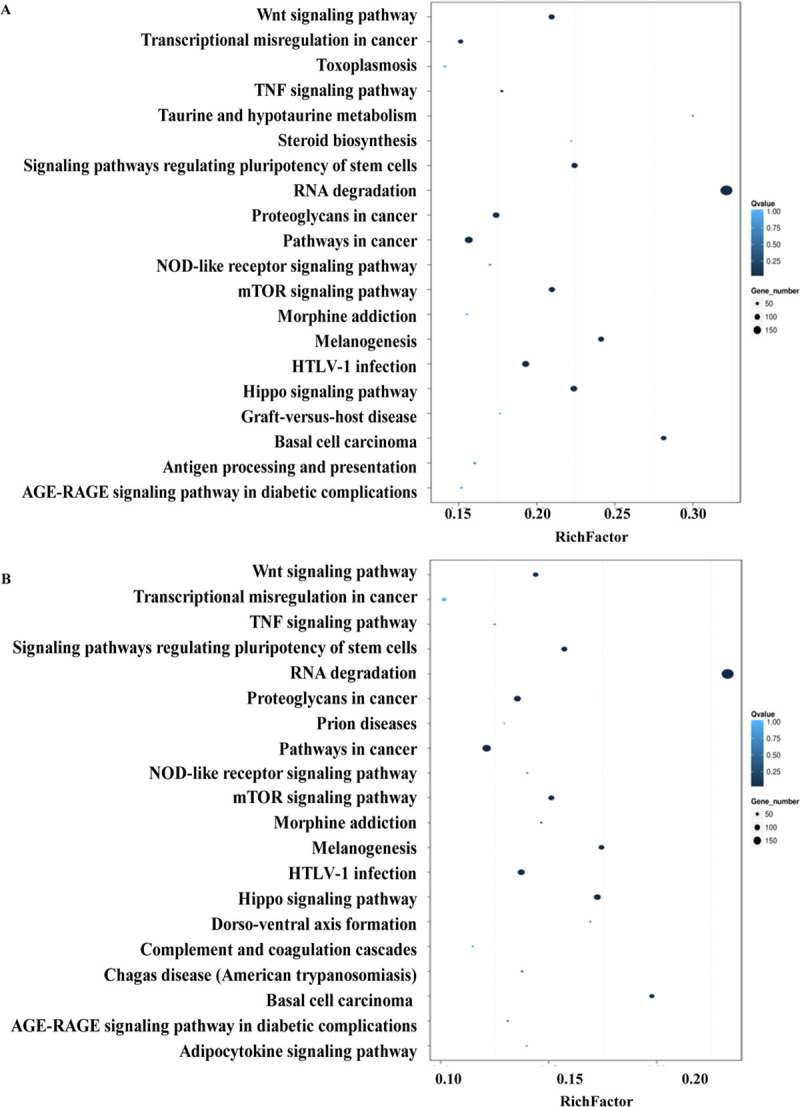
A. Pathway enrichment in H879_BGC823 vs 26695_BGC823. B. Pathway enrichment in MALT1_BGC823 vs 26695_BGC823.
Proteomic analysis
GML-related DEPs and GML-specific DEPs
Proteins are the functional molecules of cells. To gain a better understanding of the changes in proteins related to GML, the proteomes of BGC823 cells infected by GML isolates and 26695 were compared. We identified 28 and 8 up-regulated and 82 and 108 down-regulated proteins in the pairs H879_BGC823 vs 26695_BGC823 and MALT1_BGC823 vs 26695_BGC823, respectively. The number of differentially expressed proteins (DEPs) is much smaller than the number of DEGs identified by transcriptomic analysis. However, consistent with the transcriptomic analysis, the number of down-regulated proteins induced by GML isolates was much greater than the number of up-regulated proteins. We found a total of 116 proteins that were differentially expressed in BGC823 cell line infected by GML isolates compared with 26695. Among the 116 DEPs, 85 were differentially expressed when infected by GML strains compared with the 26995 standard strain (15 up-regulated and 70 down-regulated) (S2 Table). We called these 85 DEPs GML-related DEPs. By label-free analysis, another 31 proteins were found to be down-regulated in BGC823 cells when infected by GML-associated strains. These proteins were not expressed or not differentially expressed in BGC823 cells when infected by the 26695 standard strain (S2 Table). We called these 31 DEPs GML-specific DEPs.
GO analysis, diseases and biological functions of GML-related DEPs and GML-specific DEPs
By GO enrichment analysis, for both the 85 GML-related DEPs and the 31 GML-specific DEPs identified, the main biological processes are cellular process, regulation, response to stimulus, localization, metabolic processes, and the main molecular functions were classified as binding, catalytic activity, antioxidant activity, and structural molecule activity (Fig 4). The categories of cellular process, metabolic process, binding and catalytic activity were also enriched in the transcriptomic analysis. We performed disease and biological function predictions for all the DEPs and found that 54 of the 85 GML-related DEPs and 30 of the 31 GML-specific DEPs were associated with cancer. The disease related and the DEPs are listed in S3 Table.
Fig 4. GO analysis of GML-related DEPs and GML-specific DEPs revealed by proteomics.

A-C. GO analysis of the 85 GML-related DEPs. B-F. GO analysis of the 31 GML-specific DEPs.
Protein-protein interaction (PPI) networks of the DEPs
To further understand the functional associations of the identified proteins, a protein-protein interaction (PPI) network was generated using the commercial software Ingenuity Pathway Analysis (IPA). The results indicated that the 85 GML-related DEPs were clustered into five interaction networks and that the 31 GML-specific DEPs formed two interaction networks. Details can be found in S4 Table. These networks were implicated in molecular transport, lipid metabolism, endocrine system, cellular function and maintenance, cancer, DNA replication, and gene expression. In each of the networks, we can find proteins associated with cancer and gastrointestinal disease. These results suggest that the differentially expressed proteins may play important roles in gastric cancer genesis.
Upstream regulators of GML-related DEPs and GML-specific DEPs
Since most of the DEPs have been proven to be related to cancer and were clustered into compact networks, we tried to look for the molecules that regulate these DEPs by performing upstream analysis. We found a total of 63 upstream regulators that can inhibit or activate the expression of the DEPs (S5 Table). Among them, 13 upstream regulatory factors can inhibit the expression of 57 of the 85 GML-related DEPs (Fig 5A). Another 33 upstream regulatory factors can activate the expression of 70 of the 85 GML-related DEPs (Fig 5B). Three upstream regulatory factors can inhibit the expression of 10 of the 31 GML-specific DEPs (Fig 5C); another 14 upstream regulator factors can activate the expression of 24 of the 31 GML-specific DEPs (Fig 4D).
Fig 5. Upstream regulators of GML-related DEPs and GML-specific DEPs.
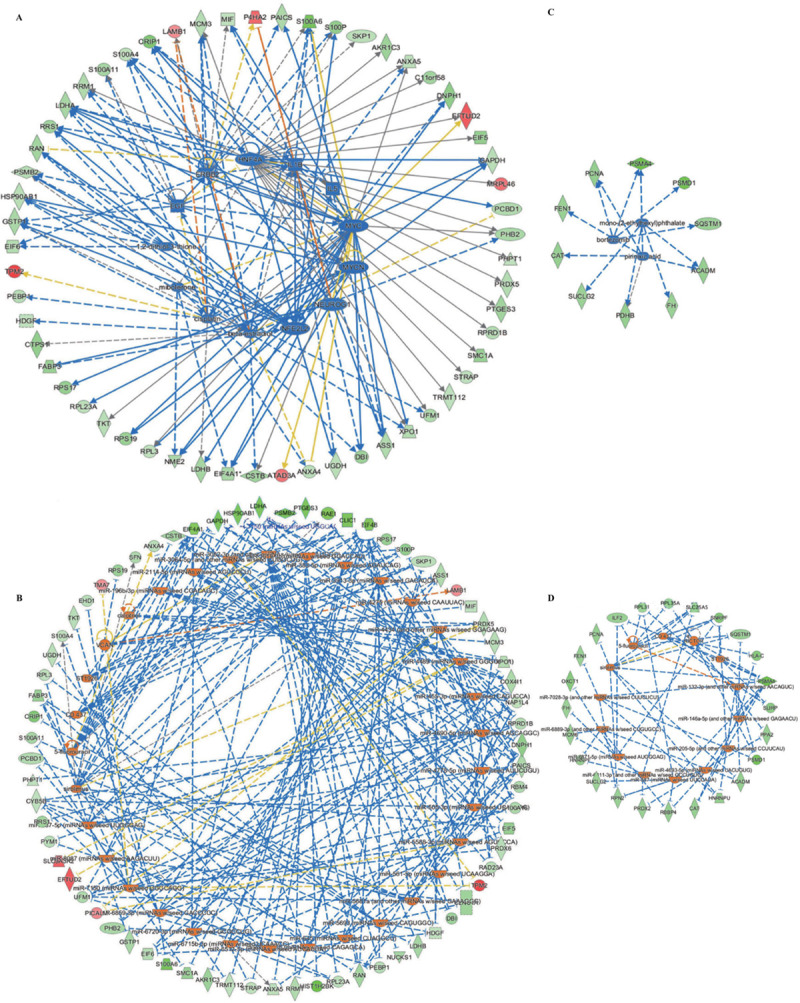
A. 13 upstream regulatory factors that can inhibit the expression of 57 of the 85 GML-related DEPs; B. 33 upstream regulator factors that can activate the expression of 70 of the 85 GML-related DEPs; C. 3 upstream regulators that can inhibit the expression of 10 of the 31 GML-specific DEPs; D. 14 upstream regulators that can activate the expression of 24 of the 31 GML-specific DEPs.
Biomarker candidates
As most of the DEPs are associated with cancer, we tried to see whether they can be used as biomarkers for diagnosis. We analyzed all the DEPs using the IPA Overlay tool and found that 23 of the 85 DEPs and 6 of the 31 DEPs have already been used as biomarkers for cancer diagnosis (Table 2). These DEPs can be found in body fluids or tissues.
Table 2. DEPs that have already been used as biomarkers for cancer diagnosis.
| Symbol | 1 | 2 | 3 | 4 | 5 | 6 | 7 | 8 | 9 | 10 | 11 | 12 | 13 | 14 | 15 | 16 | 17 | 18 | 19 | Biomarker Application(s) |
|---|---|---|---|---|---|---|---|---|---|---|---|---|---|---|---|---|---|---|---|---|
| ANXA5 | x | x | x | x | x | x | x | x | x | x | x | x | x | x | x | x | diagnosis;efficacy | |||
| CRIP1 | x | x | x | x | x | x | x | unspecified application* | ||||||||||||
| CSTB | x | x | x | x | x | x | x | x | x | diagnosis | ||||||||||
| EIF4B | x | x | x | x | x | x | x | x | x | x | unspecified application | |||||||||
| FABP3 | x | x | x | x | x | x | x | x | x | x | x | x | diagnosis;unspecified application | |||||||
| GAPDH | x | x | x | x | x | x | x | x | x | x | x | x | x | x | x | diagnosis;unspecified application | ||||
| GSTP1 | x | x | x | x | x | x | x | x | x | diagnosis;efficacy;prognosis;safety;unspecified application | ||||||||||
| HINT1 | x | x | x | x | x | x | x | x | x | x | prognosis | |||||||||
| LDHA | x | x | x | x | x | x | x | x | x | x | x | x | x | x | efficacy;unspecified application | |||||
| LDHB | x | x | x | x | x | x | x | x | x | x | x | x | x | x | x | x | x | unspecified application | ||
| MIF | x | x | x | x | x | x | x | x | x | x | x | x | x | x | diagnosis;prognosis;response to therapy | |||||
| NAP1L4 | x | x | x | x | x | x | x | x | x | x | unspecified application | |||||||||
| PEBP1 | x | x | x | x | x | x | x | x | x | x | x | x | x | x | unspecified application | |||||
| PRDX5 | x | x | x | x | x | x | x | x | x | x | x | x | x | x | x | unspecified application | ||||
| PRDX6 | x | x | x | x | x | x | x | x | x | x | x | x | x | x | unspecified application | |||||
| RRM1 | x | x | x | x | x | x | efficacy;response to therapy | |||||||||||||
| S100A4 | x | x | x | x | x | x | x | x | disease progression | |||||||||||
| S100A6 | x | x | x | x | x | x | x | x | x | x | diagnosis;unspecified application | |||||||||
| S100P | x | x | x | diagnosis;unspecified application | ||||||||||||||||
| SFN | x | x | x | x | prognosis | |||||||||||||||
| TPM2 | x | x | x | x | diagnosis | |||||||||||||||
| UGDH | x | x | x | x | x | x | x | x | x | x | x | x | diagnosis | |||||||
| XPO1 | x | x | x | x | x | x | x | diagnosis;efficacy | ||||||||||||
| ACADM | x | x | x | x | x | x | x | x | unspecified application | |||||||||||
| CAT | x | x | x | x | x | x | x | x | x | x | x | diagnosis | ||||||||
| HLA-C | x | x | x | response to therapy | ||||||||||||||||
| HNRNPU | x | x | x | x | x | x | x | x | unspecified application | |||||||||||
| PCNA | x | x | x | x | x | x | x | x | x | efficacy;prognosis;response to therapy | ||||||||||
| PDHB | unspecified application |
1.Blood; 2.Bronchoalveolar Lavage Fluid; 3.Cerebral Spinal Fluid; 4.Plasma/Serum; 5.Sputum; 6.Synovium/Synovial Fluid; 7.Tears; 8.Urine; 9.Brain; 10.Hippocampus; 11.Bladder; 12.Heart; 13.Kidney; 14.Liver; 15.Lung; 16.Ovary; 17.Stomach; 18.Lens; 19. Lymph node.
* the protein may be used as a potential marker for cancer diagnosis, prognosis, response to therapy and so on.
Combined analyses of the proteomic and transcriptomic data
Last, we performed a combined analysis on the proteomic and transcriptomic data. We found 12 common pathways in the DEGs and the DEPs (Table 3).
Table 3. Common pathways in the DEGs and the DEPs.
| Pathways | Molecules | |
|---|---|---|
| Transcriptome | Proteome | |
| Citrulline-Nitric Oxide Cycle | ASS1, NOS1 | ASS1 |
| Arginine biosynthesis IV | ASS1 | ASS1 |
| Urea cycle | ASS1 | ASS1 |
| Cell cycle: G2/M DNA damage checkpoint regulation | BTRC, CDKN1A, HIPK2, MDM4 | SFN, SKP1 |
| Aryl hydrocarbon receptor signaling | ALDH3A1, CCNE2, CDKN1A, CYP1A2, GSTM3, IL1A, IL1B, NFKB1, NR2F1, TGFB1 | GSTP1, HSP90AB1, PTGES3 |
| Pyrimidine deoxyribonucleotides de novo biosynthesis I | RRM1, RRM2B | NME2, RRM1 |
| Prostanoid biosynthesis | PTGIS | PTGES3 |
| HIPPO signaling | AJUBA, BTRC, PARD3, PPP1R3C, RASSF1, TP53BP2 | SFN, SKP1 |
| Calcium transport I | ATP2B4 | ANXA5 |
| Purine nucleotides de novo biosynthesis II | PPAT | PAICS |
| Bile acid biosynthesis, neutral pathway | AKR1C1/AKR1C2 | AKR1C3 |
| RNA signaling | KPNB1 | RAN, XPO1 |
Discussions
H. pylori infection was the first bacterial infection to be considered a type I carcinogen for its implication in gastric cancer. Thus, studies and identification of genes responsible for carcinogenesis are of great significance for diagnosis and treatment. GML is thought to be related to H. pylori infection. In the present study, we first performed transcriptomic surveys in BGC823 cell line and GES-1 cell line infected by H. pylori GML isolates and strain 26695. Our results showed BGC823 cell line is very sensitive to the infection of H.pylori, in contrast, there was little variation in GES-1 cell line with the stimulation of H.pylori. BGC823 is a human gastric carcinoma undifferentiated cell line and GES-1 is a human normal gastric epithelial cell line. The results suggest that human gastric cell lines can give us more clues for the study of GML. Consistent with this, several studies on the gene expression profiles stimulated with H. pylori used human gastric cancer cell line but not human normal gastric epithelial cell line [26–28], and BGC823 cell line were frequently used to study the H. pylori related gastric carcinogenesis and related disease [29–31]. Since there were still no specific cell line to study the H. pylori related MALT lymphoma, in this study, we selected BGC823 cell line for further analysis to get as much information as possible. Although no specific virulence factor has yet been identified in GML-associated strains to explain gastric lymphomagenesis, our results show that the BGC823 cell lines undergo similar expression responses to the GML isolates, which are different from that of 26695. The great similarity of the global patterns induced by the two GML isolates suggests some genetic variability between GML-associated strains. Our unpublished data confirmed that the transcriptome of the two GML isolates were very similar but different from that of 26695. Thus, in this study, we sought to identify specific changes stimulated by GML isolates by comparing the transcriptomes and proteomes induced by GML isolates and 26695.
The lymphomagenesis of GML is complex. We found that the DEGs and DEPs related to GML isolates were mainly associated with binding, catalytic activity, signal transducer activity, molecular function regulator, cellular processes, regulation, response to stimulus, localization, and metabolic processes. Specifically, by transcriptomic analysis, we found 15 pathways in common between the two GML isolates. Among these, the Wnt signaling pathway [32], the mTOR signaling pathway [33] and the NOD-like receptor signaling pathway [34] have been proven to be related to gastric cancer with H. pylori infection. The involvement of the Hippo signaling pathway in gastric cancer with H. pylori has begun to be studied in the last two years [35]. By deregulating these pathways, H. pylori can be implicated in gastric cancer by affecting the proliferation of cells, inducing autophagy and promoting inflammatory responses and epithelial mesenchymal transition. By integrating the transcriptomic and proteomic data, we found another 12 pathways common in both analyses. Of these pathways, it has been shown that G2/M DNA damage checkpoint regulation [36], prostanoid biosynthesis [37], HIPPO signaling [35], calcium transport I [38], and bile acid biosynthesis [39] are implicated in cancer. Currently, the roles of these pathways in the lymphomagenesis of GML are still unknown. Recently, two studies characterized the inflammatory processes in H. pylori-induced gastric lymphomagenesis in a mouse model and compared the miRNA expression profile obtained in the GML mouse model to that in human. They revealed the upregulation of a series of chemokine ligand, interleukin, tumor necrosis factor, miR-150, miR-155, miR-196a and miR-138 could be involved in the pathogenesis of GML [40, 41]. Consistent with this, in this study, by transcriptomic analysis, we found some miRNA and chemokine ligand may take roles in the pathogenesis of GML. For example, our results showed miR4461 and miR3064 were down-regulated in BGC823 cell line infected by GML isolates compared with 26695 (S6 and S7 Tables). It has been shown that miR4461 were involved in the tumorigenesis of colorectal cancer [42] and miR3064 can inhibit cell proliferation and invasion in ovarian cancer [43]. We also found IL-10, IL-17RD, IL-1A, IL-21R, IL-1B, TNFAIP8L1, TNFSF9, TNFSF14, TNFSF15, CCL28, CCL22 and CCL20 were down-regulated (S6 and S7 Tables). Further studies are needed to elucidate the correlation between these genes and pathways and the occurrence of GML.
By proteomic analysis, we found 85 GML-related DEPs and 31 GML-specific DEPs. Bio-function analysis showed that a large portion of the DEPs are related to cancer, particularly 30 of the 31 GML-specific DEPs are associated with cancer. This result suggests that the DEPs may play key roles in the carcinogenesis of gastric cancer and GML. Protein-protein interaction analysis showed that the DEPs are in several intense clusters, showing close interactions between the DEPs. By upstream regulator analysis, we found specific upstream regulators that can activate or inhibit the expression of the DEPs. Some of the upstream regulators are involved in tumor metastasis, such as beta-estradiol, MYCN, and IL1B, which can modulate the progression of steroid-sensitive breast cancers [44], promote the proliferation of non-small cell lung cancer [45] and drive metastasis and colonization of the bone microenvironment, respectively. Some of the upstream regulators can be used as potential diagnostic markers. For example, HNF4A expression can be used as a potential diagnostic tool to discriminate primary gastric cancer from breast cancer metastasis in a Brazilian cohort [46], the ERBB2 gene can be used as a diagnostic marker of early systemic cancer [47], and VCAN is a potential prognostic biomarker for gastric cancer [48]. Some can be used as potential therapeutic targets; for example, NFE2L2 can be used as a therapeutic target for glioblastoma [49], and upregulation of miR-383-5p can suppress proliferation and enhance chemosensitivity in ovarian cancer cells [50]. Further studies on these regulators may provide us with more clues for the carcinogenesis, diagnosis and treatment of GML.
Overall, primary GML is uncommon and accounts for 5% or less of all primary gastric neoplasms [51]. Although rare, GML is the most common extra nodal lymphoma, accounting for up to 20% to 50% of cases. The diagnosis of GML relies on the clinical suspicion of a lymphoproliferative disease confirmed by histopathologic data, which is often difficult because endoscopic findings of lymphomas are indistinguishable from those of benign gastritis [52]. The development of novel noninvasive biomarkers for gastric MALT lymphoma is still limited, and the diagnosis of GML is currently still challenging. We found a substantial proportion of the DEPs that have already been used as biomarkers for cancer diagnosis. These DEPs may be good candidates that warrant further investigation for their roles in the diagnosis of GML.
Conclusions
By tanscriptomic analyses, we found pathways including the Wnt signaling pathway, the mTOR signaling pathway, the NOD-like receptor signaling pathway and the Hippo signaling pathway, were revealed to be related to GML isolates. By proteomics analysis, we found 116 DEPs that were specific or related to the GML isolates. Most of these DEPs induced by GML isolates were associated with cancer, We also studied the upstream regulators that can inhibit or activate the expression of the DEPs. Finally, we found some DEPs may be used as biomarkers for GML diagnosis.
Supporting information
(DOCX)
(DOCX)
(DOCX)
(DOCX)
(DOCX)
(XLSX)
(XLSX)
(PDF)
(PDF)
Acknowledgments
We thank professor Joseph Zaia and Catherine E. Costello, Cheng Lin of Center for Biomedical Mass Spectrometry, Department of Biochemistry, Boston University for their assistance with the proteomics technical guidance.
Data Availability
The related data have been deposited in the Gene Expression Omnibus (GEO) database with the relevant accession number of GSE148112.
Funding Statement
This work was supported by The Major Infectious Diseases AIDS and Viral Hepatitis Prevention and Control Technology Major Projects (Grant No. 2018ZX10712001-006012 and Grand No. 2018ZX10733402-003002). The funders had no role in study design, data collection and analysis, decision to publish, or preparation of the manuscript.
References
- 1.Nakamura S, Yao T, Aoyagi K, Iida M, Fujishima M, et al. (1997) Helicobacter pylori and primary gastric lymphoma. A histopathologic and immunohistochemical analysis of 237 patients. Cancer 79: 3–11. [PubMed] [Google Scholar]
- 2.Parsonnet J, Hansen S, Rodriguez L, Gelb AB, Warnke RA, et al. (1994) Helicobacter pylori infection and gastric lymphoma. N Engl J Med 330: 1267–1271. [DOI] [PubMed] [Google Scholar]
- 3.Thiede C, Morgner A, Alpen B, Wundisch T, Herrmann J, et al. (1997) What role does Helicobacter pylori eradication play in gastric MALT and gastric MALT lymphoma? Gastroenterology 113: S61–64. [DOI] [PubMed] [Google Scholar]
- 4.Nobre-Leitao C, Lage P, Cravo M, Cabecadas J, Chaves P, et al. (1998) Treatment of gastric MALT lymphoma by Helicobacter pylori eradication: a study controlled by endoscopic ultrasonography. Am J Gastroenterol 93: 732–736. [DOI] [PubMed] [Google Scholar]
- 5.Malfertheiner P, Megraud F, O'Morain CA, Atherton J, Axon AT, et al. (2012) Management of Helicobacter pylori infection—the Maastricht IV/ Florence Consensus Report. Gut 61: 646–664. [DOI] [PubMed] [Google Scholar]
- 6.Du MQ, Isaccson PG (2002) Gastric MALT lymphoma: from aetiology to treatment. Lancet Oncol 3: 97–104. [DOI] [PubMed] [Google Scholar]
- 7.de Jong D, Aleman BM, Taal BG, Boot H (1999) Controversies and consensus in the diagnosis, work-up and treatment of gastric lymphoma: an international survey. Ann Oncol 10: 275–280. [DOI] [PubMed] [Google Scholar]
- 8.Wang HC, Cheng FC, Wu MS, Shu HY, Sun HS, et al. (2015) Genome Sequences of Three Helicobacter pylori Strains from Patients with Gastric Mucosa-Associated Lymphoid Tissue Lymphoma. Genome Announc 3. [DOI] [PMC free article] [PubMed] [Google Scholar]
- 9.Eck M, Schmausser B, Haas R, Greiner A, Czub S, et al. (1997) MALT-type lymphoma of the stomach is associated with Helicobacter pylori strains expressing the CagA protein. Gastroenterology 112: 1482–1486. [DOI] [PubMed] [Google Scholar]
- 10.Lehours P, Menard A, Dupouy S, Bergey B, Richy F, et al. (2004) Evaluation of the association of nine Helicobacter pylori virulence factors with strains involved in low-grade gastric mucosa-associated lymphoid tissue lymphoma. Infect Immun 72: 880–888. [DOI] [PMC free article] [PubMed] [Google Scholar]
- 11.Yamaoka Y (2008) Roles of Helicobacter pylori BabA in gastroduodenal pathogenesis. World J Gastroenterol 14: 4265–4272. [DOI] [PMC free article] [PubMed] [Google Scholar]
- 12.Backert S, Gressmann H, Kwok T, Zimny-Arndt U, Konig W, et al. (2005) Gene expression and protein profiling of AGS gastric epithelial cells upon infection with Helicobacter pylori. Proteomics 5: 3902–3918. [DOI] [PubMed] [Google Scholar]
- 13.Sepulveda AR, Tao H, Carloni E, Sepulveda J, Graham DY, et al. (2002) Screening of gene expression profiles in gastric epithelial cells induced by Helicobacter pylori using microarray analysis. Aliment Pharmacol Ther 16 Suppl 2: 145–157. [DOI] [PubMed] [Google Scholar]
- 14.Mannick EE, Schurr JR, Zapata A, Lentz JJ, Gastanaduy M, et al. (2004) Gene expression in gastric biopsies from patients infected with Helicobacter pylori. Scand J Gastroenterol 39: 1192–1200. [DOI] [PubMed] [Google Scholar]
- 15.Wen S, Felley CP, Bouzourene H, Reimers M, Michetti P, et al. (2004) Inflammatory gene profiles in gastric mucosa during Helicobacter pylori infection in humans. J Immunol 172: 2595–2606. [DOI] [PubMed] [Google Scholar]
- 16.Zhang BG, Hu L, Zang MD, Wang HX, Zhao W, et al. (2016) Helicobacter pylori CagA induces tumor suppressor gene hypermethylation by upregulating DNMT1 via AKT-NFkappaB pathway in gastric cancer development. Oncotarget 7: 9788–9800. [DOI] [PMC free article] [PubMed] [Google Scholar]
- 17.Thompson A, Schafer J, Kuhn K, Kienle S, Schwarz J, et al. (2003) Tandem mass tags: a novel quantification strategy for comparative analysis of complex protein mixtures by MS/MS. Anal Chem 75: 1895–1904. [DOI] [PubMed] [Google Scholar]
- 18.Langmead B, Trapnell C, Pop M, Salzberg SL (2009) Ultrafast and memory-efficient alignment of short DNA sequences to the human genome. Genome Biol 10: R25. [DOI] [PMC free article] [PubMed] [Google Scholar]
- 19.Kim D, Langmead B, Salzberg SL (2015) HISAT: a fast spliced aligner with low memory requirements. Nat Methods 12: 357–360. [DOI] [PMC free article] [PubMed] [Google Scholar]
- 20.Audic S, Claverie JM (1997) The significance of digital gene expression profiles. Genome Res 7: 986–995. [DOI] [PubMed] [Google Scholar]
- 21.Abdi H (2007) The bonferroni and Sidak corrections for multiple comparisons. In Salkind NJ(ed)Encyclopedia of Measurement and Statistics Thousand Oaks, CA: Sage. [Google Scholar]
- 22.Benjamini YD. Yekutieli. (2001) The control of the false discovery rate in multiple testing under dependency. The Annals of Statistics 29: 1165–1188. [Google Scholar]
- 23.Eisen MB, Spellman PT, Brown PO, Botstein D (1998) Cluster analysis and display of genome-wide expression patterns. Proc Natl Acad Sci U S A 95: 14863–14868. [DOI] [PMC free article] [PubMed] [Google Scholar]
- 24.de Hoon MJ, Imoto S, Nolan J, Miyano S (2004) Open source clustering software. Bioinformatics 20: 1453–1454. [DOI] [PubMed] [Google Scholar]
- 25.Saldanha AJ (2004) Java Treeview—extensible visualization of microarray data. Bioinformatics 20: 3246–3248. [DOI] [PubMed] [Google Scholar]
- 26.Bach S, Makristathis A, Rotter M, Hirschl AM (2002) Gene expression profiling in AGS cells stimulated with Helicobacter pylori isogenic strains (cagA positive or cagA negative). Infect Immun 70: 988–992. [DOI] [PMC free article] [PubMed] [Google Scholar]
- 27.Kim SH, Sierra RA, McGee DJ, Zabaleta J (2012) Transcriptional profiling of gastric epithelial cells infected with wild type or arginase-deficient Helicobacter pylori. BMC Microbiol 12: 175. [DOI] [PMC free article] [PubMed] [Google Scholar]
- 28.Maeda S, Otsuka M, Hirata Y, Mitsuno Y, Yoshida H, et al. (2001) cDNA microarray analysis of Helicobacter pylori-mediated alteration of gene expression in gastric cancer cells. Biochem Biophys Res Commun 284: 443–449. [DOI] [PubMed] [Google Scholar]
- 29.Huang L, Guo Y, Cao D, Liu X, Zhang L, et al. (2018) Effects of Helicobacter pylori on the expression levels of GATA-3 and connexin 32 and the GJIC function in gastric epithelial cells and their association by promoter analysis. Oncol Lett 16: 1650–1658. [DOI] [PMC free article] [PubMed] [Google Scholar]
- 30.Liu XM, Xu CX, Zhang LF, Huang LH, Hu TZ, et al. (2017) PBX1 attributes as a determinant of connexin 32 downregulation in Helicobacter pylori-related gastric carcinogenesis. World J Gastroenterol 23: 5345–5355. [DOI] [PMC free article] [PubMed] [Google Scholar]
- 31.Xu CX, Qi YM, Yang WB, Wang F, Zhou JD, et al. (2007) [Effect of CagA(+) helicobacter pylori strain on the expression of connexin 43 and cell proliferation in BGC-823 cells]. Zhong Nan Da Xue Xue Bao Yi Xue Ban 32: 288–294. [PubMed] [Google Scholar]
- 32.Neal JT, Peterson TS, Kent ML, Guillemin K (2013) H. pylori virulence factor CagA increases intestinal cell proliferation by Wnt pathway activation in a transgenic zebrafish model. Dis Model Mech 6: 802–810. [DOI] [PMC free article] [PubMed] [Google Scholar]
- 33.Li N, Tang B, Jia YP, Zhu P, Zhuang Y, et al. (2017) Helicobacter pylori CagA Protein Negatively Regulates Autophagy and Promotes Inflammatory Response via c-Met-PI3K/Akt-mTOR Signaling Pathway. Front Cell Infect Microbiol 7: 417. [DOI] [PMC free article] [PubMed] [Google Scholar]
- 34.Castano-Rodriguez N, Kaakoush NO, Goh KL, Fock KM, Mitchell HM (2014) The NOD-like receptor signalling pathway in Helicobacter pylori infection and related gastric cancer: a case-control study and gene expression analyses. PLoS One 9: e98899. [DOI] [PMC free article] [PubMed] [Google Scholar]
- 35.Li N, Feng Y, Hu Y, He C, Xie C, et al. (2018) Helicobacter pylori CagA promotes epithelial mesenchymal transition in gastric carcinogenesis via triggering oncogenic YAP pathway. J Exp Clin Cancer Res 37: 280. [DOI] [PMC free article] [PubMed] [Google Scholar]
- 36.Sarin N, Engel F, Kalayda GV, Mannewitz M, Cinatl J Jr., et al. (2017) Cisplatin resistance in non-small cell lung cancer cells is associated with an abrogation of cisplatin-induced G2/M cell cycle arrest. PLoS One 12: e0181081. [DOI] [PMC free article] [PubMed] [Google Scholar]
- 37.Cathcart MC, O'Byrne KJ, Reynolds JV, O'Sullivan J, Pidgeon GP(2012) COX-derived prostanoid pathways in gastrointestinal cancer development and progression: novel targets for prevention and intervention. Biochim Biophys Acta 1825: 49–63. [DOI] [PubMed] [Google Scholar]
- 38.Romero-Garcia S, Prado-Garcia H (2019) Mitochondrial calcium: Transport and modulation of cellular processes in homeostasis and cancer (Review). Int J Oncol 54: 1155–1167. [DOI] [PubMed] [Google Scholar]
- 39.Nair P, Turjman N (1983) Role of bile acids and neutral sterols in familial cancer syndromes of the colon. Dis Colon Rectum 26: 629–632. [DOI] [PubMed] [Google Scholar]
- 40.Floch P, Laur AM, Korolik V, Chrisment D, Cappellen D, et al. (2015) Characterisation of inflammatory processes in Helicobacter pylori-induced gastric lymphomagenesis in a mouse model. Oncotarget 6: 34525–34536. [DOI] [PMC free article] [PubMed] [Google Scholar]
- 41.Blosse A, Levy M, Robe C, Staedel C, Copie-Bergman C, et al. (2019) Deregulation of miRNA in Helicobacter pylori-Induced Gastric MALT Lymphoma: From Mice to Human. J Clin Med 8. [DOI] [PMC free article] [PubMed] [Google Scholar]
- 42.Chen HL, Li JJ, Jiang F, Shi WJ, Chang GY (2019) MicroRNA-4461 derived from bone marrow mesenchymal stem cell exosomes inhibits tumorigenesis by downregulating COPB2 expression in colorectal cancer. Biosci Biotechnol Biochem: 1–9. [DOI] [PubMed] [Google Scholar]
- 43.Bai L, Wang H, Wang AH, Zhang LY, Bai J (2017) MicroRNA-532 and microRNA-3064 inhibit cell proliferation and invasion by acting as direct regulators of human telomerase reverse transcriptase in ovarian cancer. PLoS One 12: e0173912. [DOI] [PMC free article] [PubMed] [Google Scholar]
- 44.Paduch R, Kandefer-Szerszen M (2005) Vitamin D, tamoxifen and beta-estradiol modulate breast cancer cell growth and interleukin-6 and metalloproteinase-2 production in three-dimensional co-cultures of tumor cell spheroids with endothelium. Cell Biol Toxicol 21: 247–256. [DOI] [PubMed] [Google Scholar]
- 45.Liu K, Wang S, Liu Y, Gu J, Gu S, et al. (2016) Overexpression of MYCN promotes proliferation of non-small cell lung cancer. Tumour Biol 37: 12855–12866. [DOI] [PubMed] [Google Scholar]
- 46.Juca P, Correa S, Vignal GM, Accioly MTS, Lustosa SAS, et al. (2017) HNF4A expression as a potential diagnostic tool to discriminate primary gastric cancer from breast cancer metastasis in a Brazilian cohort. Diagn Pathol 12: 43. [DOI] [PMC free article] [PubMed] [Google Scholar]
- 47.Hoffmann M, Pasch S, Schamberger T, Maneck M, Mohlendick B, et al. (2018) Diagnostic pathology of early systemic cancer: ERBB2 gene amplification in single disseminated cancer cells determines patient survival in operable esophageal cancer. Int J Cancer 142: 833–843. [DOI] [PubMed] [Google Scholar]
- 48.Jiang K, Liu H, Xie D, Xiao Q (2019) Differentially expressed genes ASPN, COL1A1, FN1, VCAN and MUC5AC are potential prognostic biomarkers for gastric cancer. Oncol Lett 17: 3191–3202. [DOI] [PMC free article] [PubMed] [Google Scholar]
- 49.Rajesh Y, Biswas A, Kumar U, Das S, Banerjee I, et al. (2019) Targeting NFE2L2, a transcription factor upstream of MMP-2: A potential therapeutic strategy for temozolomide resistant glioblastoma. Biochem Pharmacol 164: 1–16. [DOI] [PubMed] [Google Scholar]
- 50.Jiang J, Xie C, Liu Y, Shi Q, Chen Y (2019) Up-regulation of miR-383-5p suppresses proliferation and enhances chemosensitivity in ovarian cancer cells by targeting TRIM27. Biomed Pharmacother 109: 595–601. [DOI] [PubMed] [Google Scholar]
- 51.Al-Akwaa AM, Siddiqui N, Al-Mofleh IA (2004) Primary gastric lymphoma. World J Gastroenterol 10: 5–11. [DOI] [PMC free article] [PubMed] [Google Scholar]
- 52.Seifert E, Schulte F, Weismuller J, de Mas CR, Stolte M (1993) Endoscopic and bioptic diagnosis of malignant non-Hodgkin's lymphoma of the stomach. Endoscopy 25: 497–501. [DOI] [PubMed] [Google Scholar]
Associated Data
This section collects any data citations, data availability statements, or supplementary materials included in this article.
Supplementary Materials
(DOCX)
(DOCX)
(DOCX)
(DOCX)
(DOCX)
(XLSX)
(XLSX)
(PDF)
(PDF)
Data Availability Statement
The related data have been deposited in the Gene Expression Omnibus (GEO) database with the relevant accession number of GSE148112.