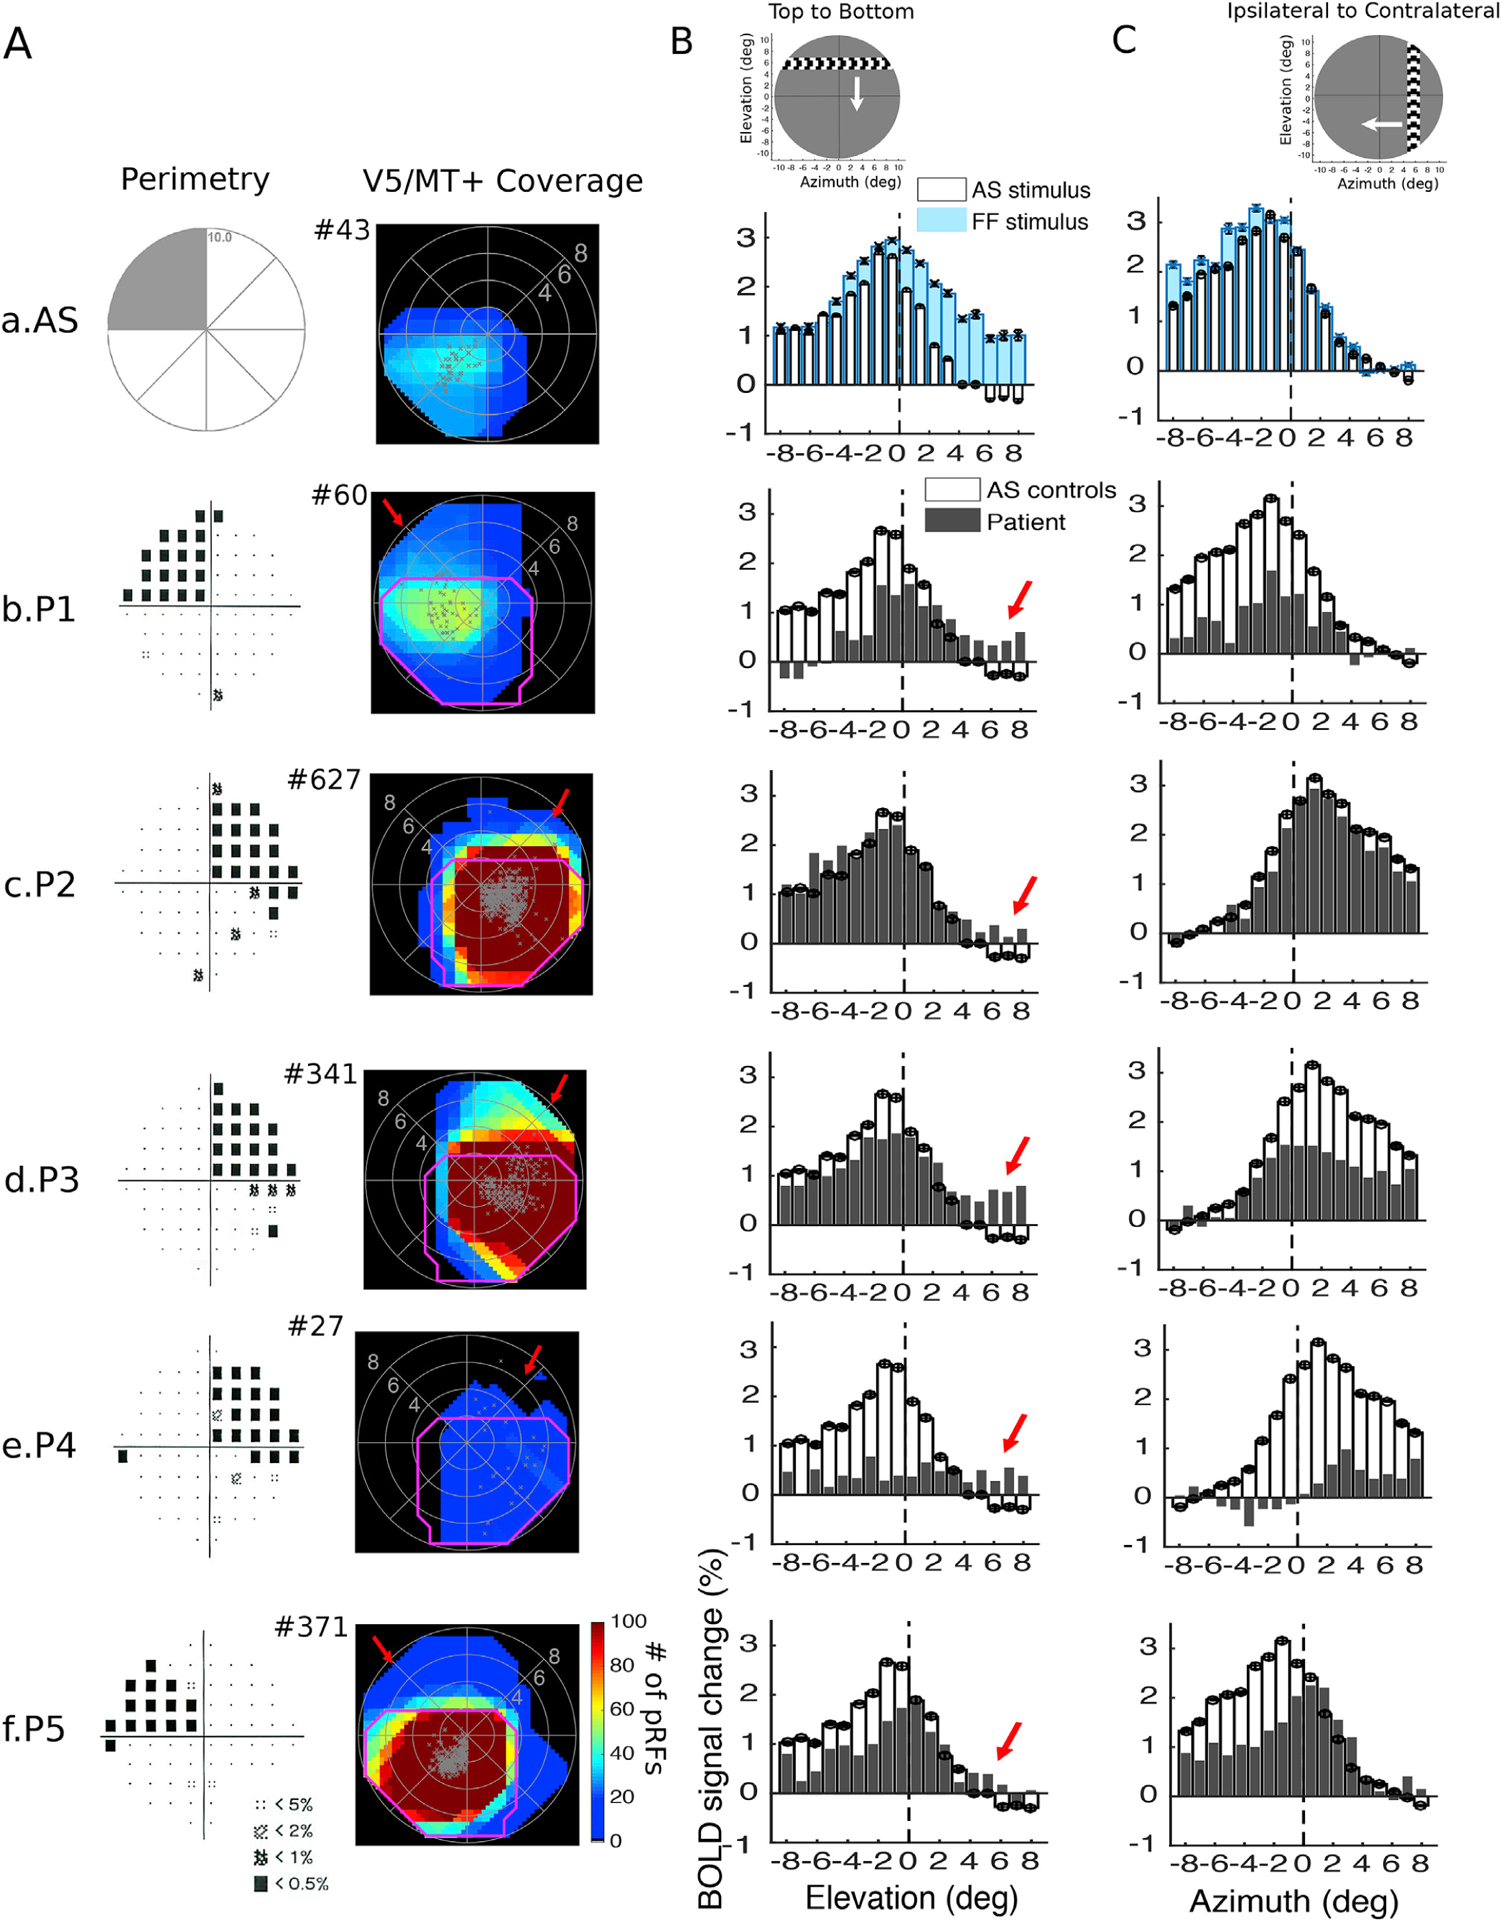
Fig. 3. Visual field coverage maps and average BOLD signal change in hV5/MT+ of the lesioned hemisphere.

A. Left: Pattern deviation probability plots of the 10-degree Humphrey type visual field test for all patients as shown in Fig. 2B. Right: Visual field coverage density maps of area hV5/MT+ of the right hemisphere of an AS control subject (a) and of the lesioned hemisphere for each patient obtained using the proposed pRF boundary mapping method (b–f). To allow comparison between subjects, the scale of the color map has been clipped to the average significantly activated number of voxels of hV5/MT+ of AS controls (97.8 ± 89.15). The total number of significantly activated voxels in hV5/MT+ of each subject is indicated next to the graphs with a # symbol. The pRF centers from all voxels within each area are plotted as grey dots. The average coverage density map of all AS controls is overlaid on top of the maps of each patient with magenta color. In contrast to the AS controls, the visual field coverage maps of hV5/MT+ of all patients cover areas that overlap with the dense visual field scotoma (red arrows). B. The average BOLD signal change from all voxels in the right hV5/MT+ in controls and the hV5/MT+ of the lesioned hemisphere in patients as a horizontal bar is moving from the top (elevation>0; AS/scotoma) to the bottom of the visual field (elevation<0; seeing quadrant). Before averaging, the BOLD time series of each voxel is deconvolved to remove the hemodynamic response function (Methods) and the baseline is removed. The baseline here is defined as the signal value when the vertical bar is located in the far ipsilesional part of the visual field, which should produce little or no visual modulation in the region examined. This is calculated as the average BOLD signal change over 5 steps of the bar when the horizontal bar was located between 7 and 10° in the hemifield ipsilateral to our ROI. This procedure sets the baseline of each voxel to zero. (a) The average signal of the AS controls (white bars) is compared with the full field stimulus condition (blue bars). When the AS is applied, the average BOLD signal change when the bar is in the superior quadrant (location of the AS; elevation>0) drops to baseline values compared with the average signal under the full field stimulus condition. Activity starts when the bar is near 2° from the horizontal meridian (AS border), commensurate with the subject’s fixation eye movements. (b–f) The average signal of the patients (grey bars) compared with the AS controls (white bars). For all patients, activity starts when the stimulus is located well within the perceptual scotoma (elevation>3°, red arrows) in contrast to the AS controls. The error bars indicate the standard error of the mean across control subjects (N = 5). The snapshot on top shows the orientation of the bar and direction of motion (white arrow). C. Same as in (B), the average BOLD signal change from all voxels in the right hV5/MT+ in controls and the hV5/MT+ of the lesioned hemisphere in patients as a vertical bar is moving from the contralateral (azimuth>0) to the ipsilateral visual hemifield (azimuth<0). For all patients, activity starts when the stimulus is located about 2–3° within the ipsilateral visual hemifield, similar to the AS control subjects. This suggests that, hV5/MT+ activity in the lesioned hemisphere originates from stimulus positions located within the scotoma, and less likely from the contralateral hemisphere.
