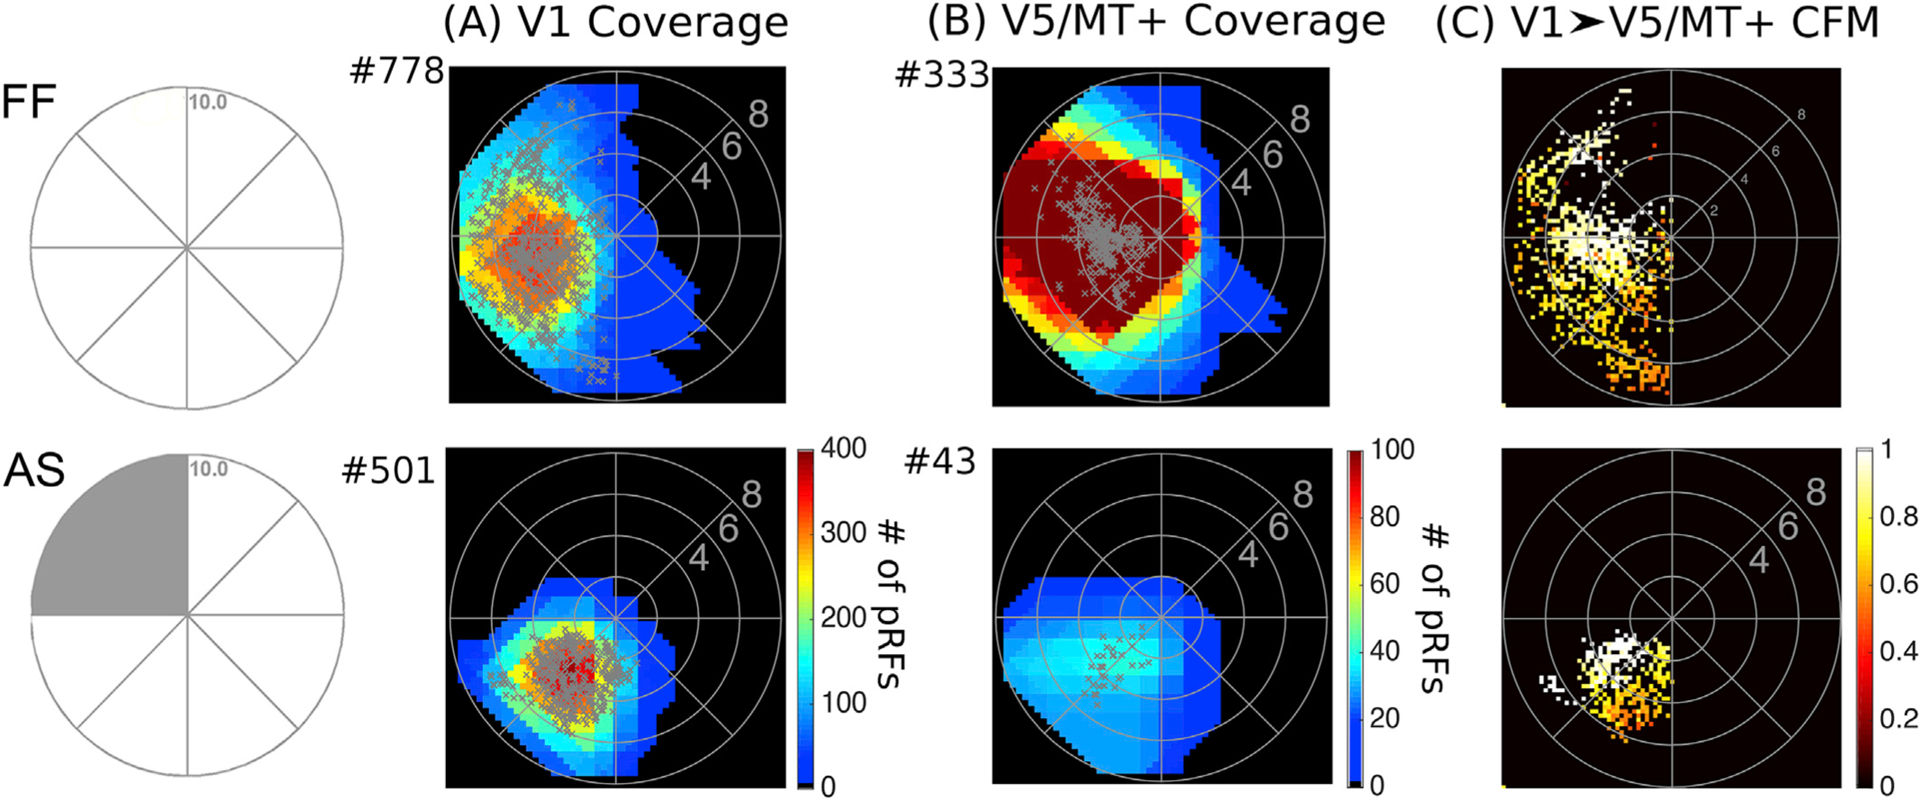
Fig. 4. Visual field coverage maps of V1 and hV5/MT+ in Control Subjects.

Top: Visual field coverage density maps of area V1 (A) and the hV5/MT+ complex (B) of the right hemisphere of a control subject under Full Field (FF) stimulation. The pRF centers from all voxels within each area are plotted as grey dots. Both areas cover the entire left visual hemifield, as expected. Bottom: Visual field coverage density maps of V1 (A) and hV5/MT+ (B) of the right hemisphere of a control subject under the Artificial Scotoma (AS) condition. No activity is observed within the area of the AS in control subjects for both V1 and hV5/MT+. C. Visual field coverage maps of hV5/MT+ based on the connective field modeling method (CFM) for a control subject under FF stimulation (top) and under the AS condition (bottom). These maps plot, for each voxel in hV5/MT+, the pRFs of the voxels corresponding to the CF center and CF Gaussian spread in the cortical surface of V1. The color map indicates the CF weight so that 1 corresponds to the CF center. CFM coverage maps in control subjects are commensurate to the pRF coverage density maps suggesting that hV5/MT+ activity arises chiefly from area V1.
