
Figure 3.
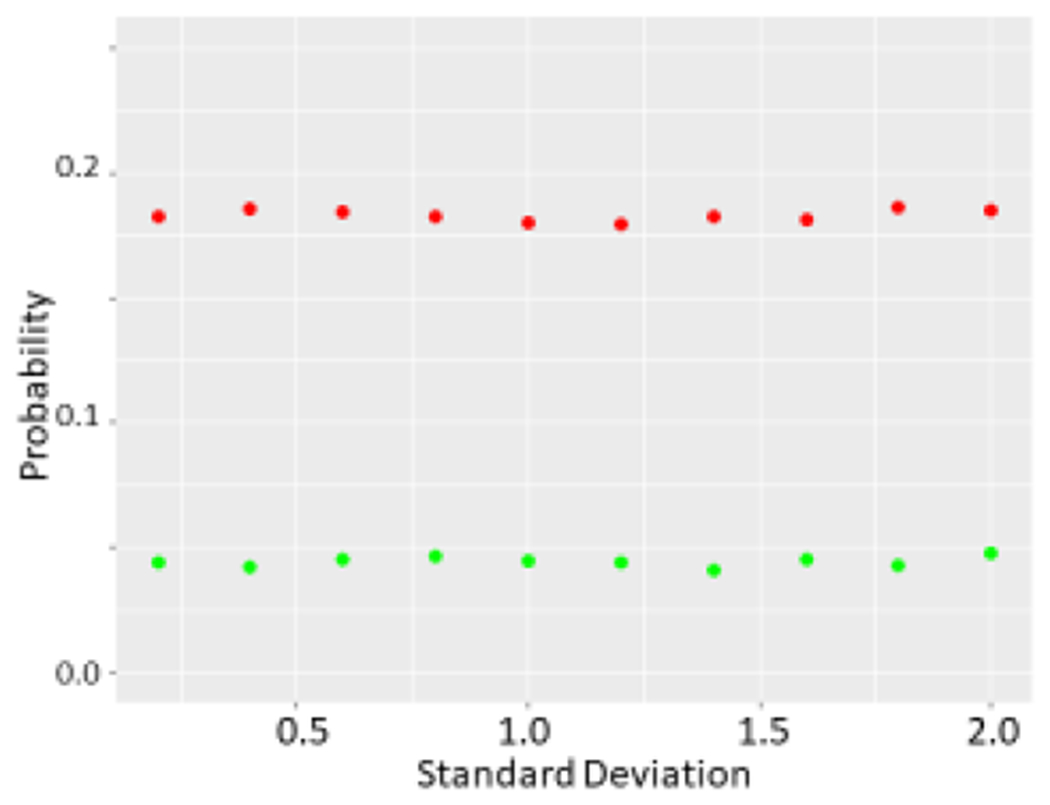

a The effect of varying SD on probability of a p<0.05 difference determined by the t-test. Again green refers to unmodified sets whereas red refers to sets where top value of one and bottom value of other are dropped. N=10 was used for unmodified sets.
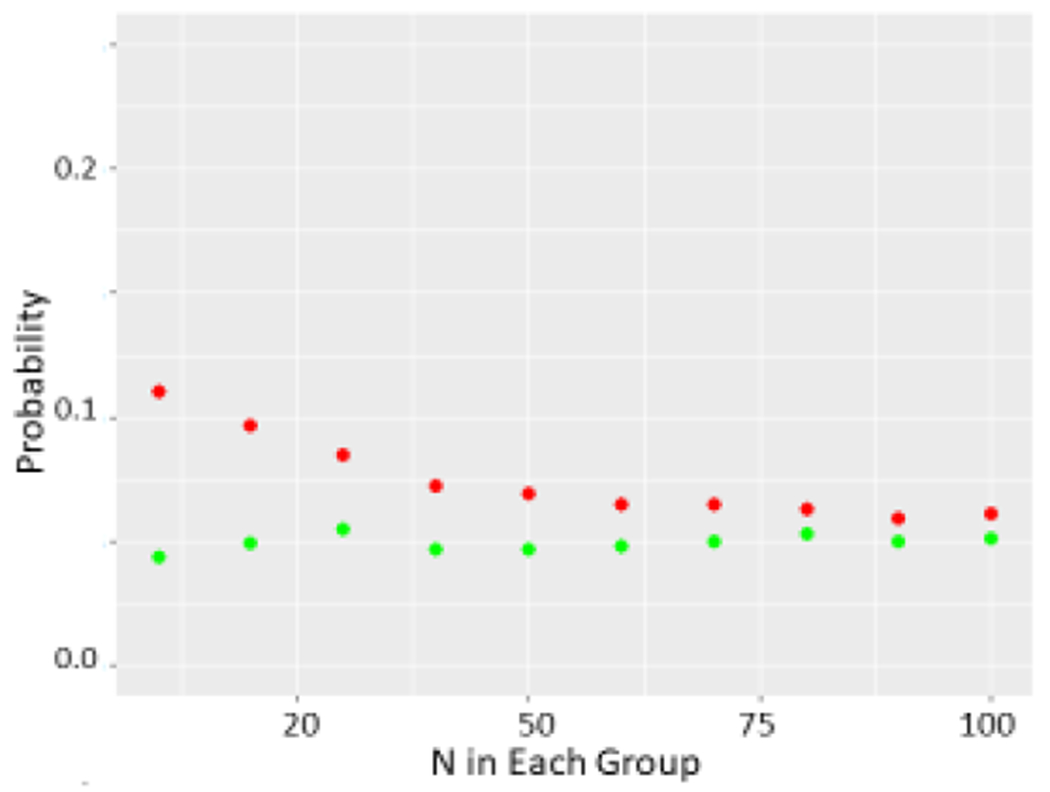
b Wilcoxon test performed on two sets as described previously as N was allowed to range from 10 to 100.
c Probability of obtaining a p<0.05 value with initial N=10 in each group (green) as the number of pairs of top and bottom values which are dropped (red) is increased from 1 to 5.