Figure 4.

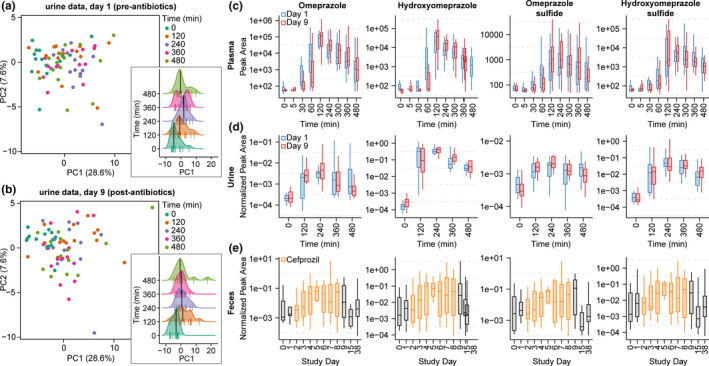
Principal component analysis of untargeted metabolomics urine data for (a) study day 1 (pre‐antibiotics) and (b) study day 9 (postantibiotics). Points represent urine samples and are colored by the time in which they were collected after drug consumption. Density plots for principal component (PC)1 values are inset. Lines at the bottom of each distribution reflect individual points, the median value is indicated (black line), and the distributions are offset by time. (c) Plot of time vs. peak area (log‐scaled) for omeprazole, hydroxyomeprazole, omeprazole sulfide, and hydroxyomeprazole sulfide in plasma samples. (d) Plot of time vs. peak area normalized by creatinine (log‐scaled) for omeprazole, hydroxyomeprazole, omeprazole sulfide, and hydroxyomeprazole sulfide in urine samples. (e) Plot of study day vs. peak area normalized to stercobilin (log‐scaled) for omeprazole, hydroxyomeprazole, omeprazole sulfide, and hydroxyomeprazole sulfide in fecal samples obtained daily. The period of antibiotic use is indicated in orange. The boxes represent the 25%, 50%, and 75% quantile and the whiskers extend ± 1.5 times the interquartile range. Note, values are log10‐scaled to facilitate interpretation and points with nonfinite values are not displayed; however, statistical analyses were performed using all points.
