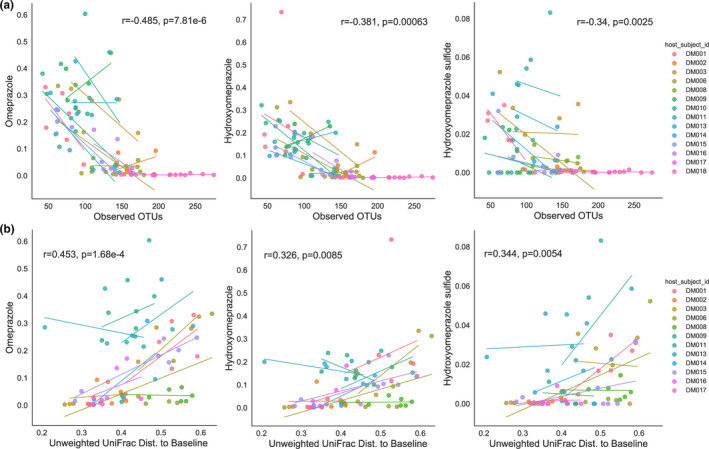
Figure 5.

Correlations among fecal omeprazole (OME), 5‐hydroxy (5‐OH) OME, and 5‐OH OME sulfide levels, and (a) alpha diversity (observed operational taxonomic unit (OTUs)) or (b) unweighted UniFrac distance to each subject’s baseline sample. Plots display regression lines for each individual subject and statistics displayed are from the repeated measures correlation using days 2–9. Subjects DM10 and DM18 were omitted as their study day 0 (baseline) samples were either below the sequencing quality threshold or not collected.
