
Figure 4.
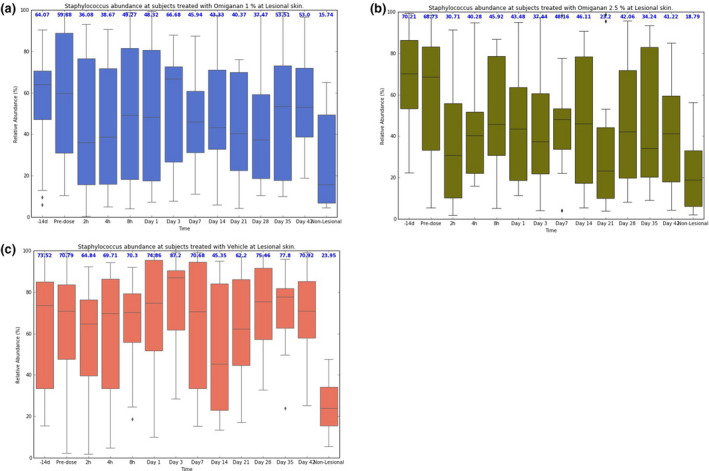
Course of cutaneous microbiome after omiganan treatment over time. Relative Staphylococcus abundance over time in the (a) omiganan 1%, (b) omiganan 2.5%, and (c) vehicle groups. A reduction is seen in both active treatment groups, but not in the vehicle group. Nonlesional boxes are presented as control on the right side. Median values are shown in blue above the boxplots.