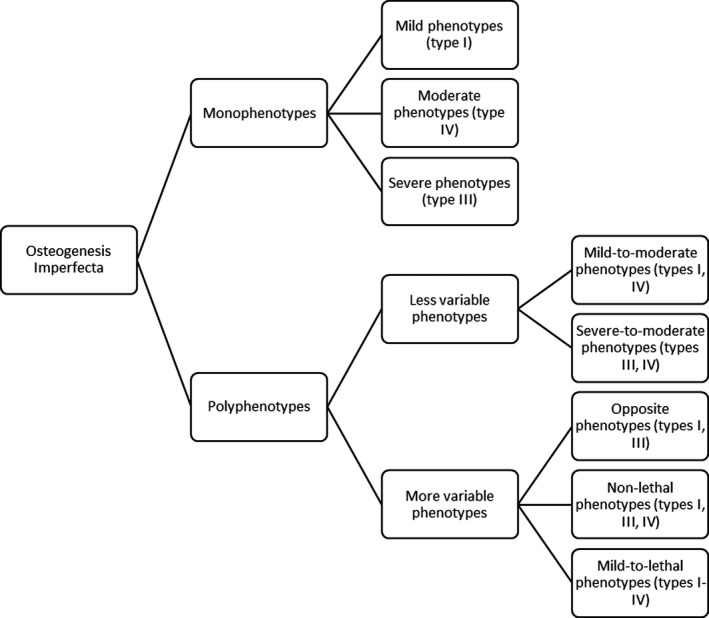
Figure 2.

Clustering of the osteogenesis imperfecta (OI) phenotypic variability groups, formed on the basis of the genotype‐phenotype variability analysis and the severity scale of clinical symptoms. Mild phenotype ‐ OI type I, moderate phenotype ‐ OI type IV, severe phenotype ‐ OI type III, and lethal phenotype ‐ OI type II.
