
Figure 2.
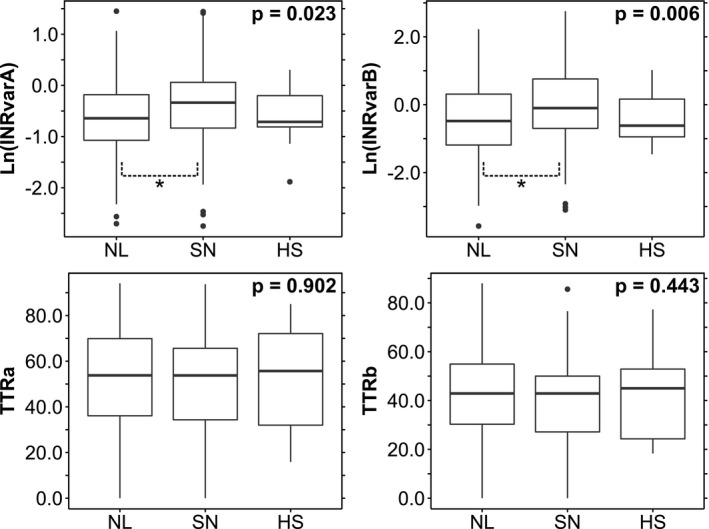
Associations of outcome measures with genotype‐predicted warfarin response. Bounds of the box‐and‐whisker plots are discussed in the Methods section. Each P value corresponds to a one‐way analysis of variance test for an international normalized ratio (INR) outcome measure against the three combined cytochrome P450 (CYP)2C9/vitamin K epoxide reductase complex (VKORC)1 genotype‐predicted responder categories (Table 2 ). Post hoc pairwise comparisons were made using Tukey’s HSD. *Indicates a significant pairwise comparison at the P < 0.05 level. HS, highly sensitive; NL, normal; SN, sensitive; TTR, time in therapeutic range.