
Figure 4.
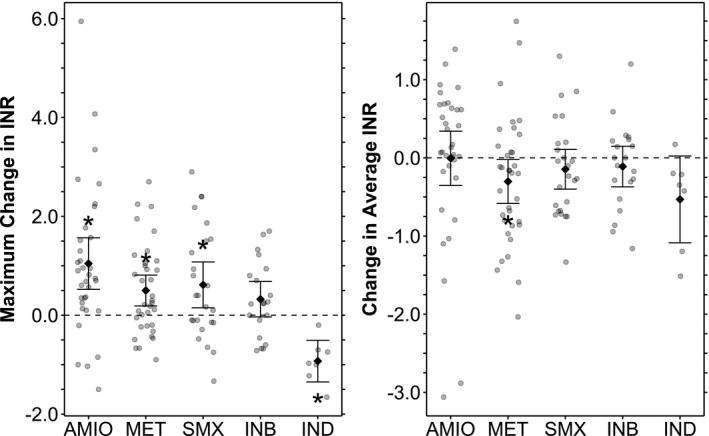
International normalized ratio (INR) differences before and after cytochrome P450 (CYP)2C9‐interacting drug exposure. Mean values with 95% confidence intervals are shown superimposed on the individual data. Maximum change in INR refers to the magnitude of maximum perturbation from the baseline INR after initiating an interacting drug. The baseline INR is defined by average INR in a study period prior to exposure to an interacting drug. The maximum perturbation is defined by peak INR after initiation of a CYP2C9 inhibitor, and by trough INR after initiation of a CYP2C9 inducer. Change in average INR refers to the difference between baseline INR as described above and the average INR in a time period shortly after initiation of an interacting drug. Tabulated data are presented in Table S11 . For each listed mean INR difference, the P value corresponds to a t‐test comparing the two sets of INRs included in the difference. *Indicates statistical significance at the P < 0.05 level. AMIO, amiodarone; INB, CYP2C9‐inhibitors; IND, CYP2C9‐inducers; MET, metronidozole; SMX, suflamethoxazole.