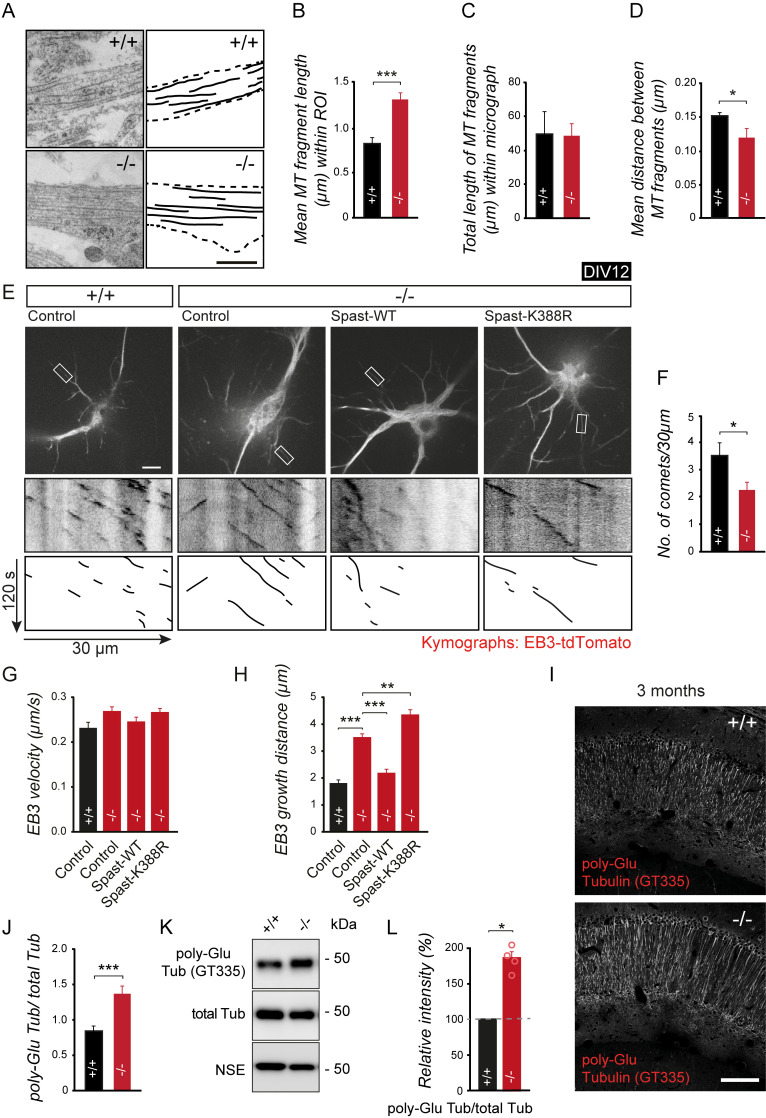
Fig 5. Spastin depletion alters growth and structure of MTs.
(A) Electron micrograph of MT in DIV14 neurons. Note that because of ultrathin sectioning, MTs appear as fragments in three-dimensional dendrites growing across other neurites. Scale bar, 200 nm. (B-D) Quantification of MT mean fragment length, total fragment length, and inter-microtubule fragment distance. (+/+) n = 20, (−/−) n = 14 based on three independent neuronal cultures per group. (E-H) Live imaging of EB3-tdTomato in DIV12 neurons following coexpression of different GFP-Spastin constructs, as indicated. (E) Upper panel depicts GFP expression. Lower panels: representative kymographs of EB3-tdTomato acquired from secondary dendrites (white rectangle). Scale bar, 10 μm. Quantification of (F) comet number, (G) velocity, and (H) growth distance; (+/+_GFP) n = 36 (12 cells), (−/−_GFP) n = 80 (27 cells), (−/−_Spast-WT) n = 42 (14 cells), (−/−_Spast-K388R) n = 48 (16 cells). (I) Immunostaining of polyglutamylated tubulin (GT335 antibody) in CA1. (+/+), n = 9 mice; (−/−), n = 9 mice. Scale bar, 100 μm. (J) Quantification of (I). (K, L) Quantitative western blot analysis of Poly-Glu Tub, total α-Tub, and NSE (loading control). (+/+) n = 4, (−/−) n = 4, **p < 0.01, ***p < 0.001. Student t test (B-D and J), ANOVA followed by pairwise comparison (F-H), and one-way ANOVA (L) were used to assess statistical significance. Data are represented as means ± SEM. Individual quantitative observations that underlie the data presented in this figure are summarized in S5 Data. DIV, days in vitro; EB3, end-binding protein 3; GFP, green fluorescent protein MT, microtubule; NSE, neuron specific enolase; Poly-Glu, polyglutamylation; PTM, posttranslational modification; ROI, region of interest; Tub, tubulin; WT, wild-type.

