
Figure 2.
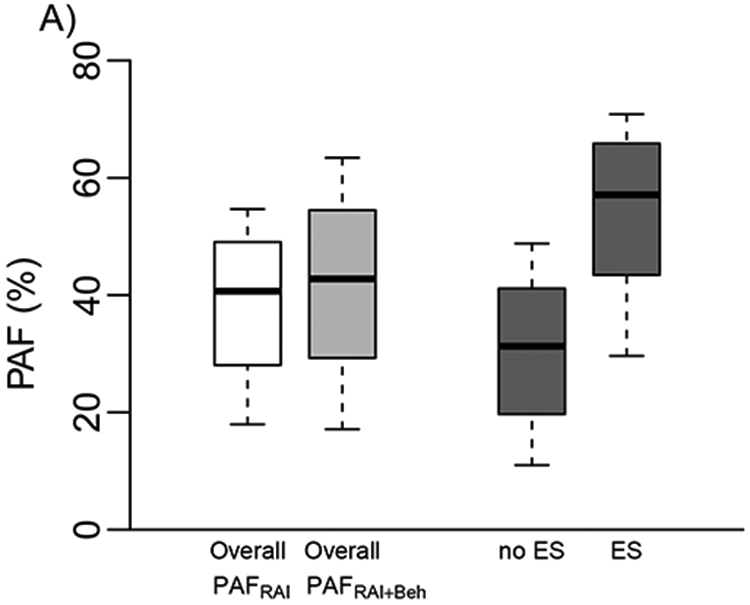
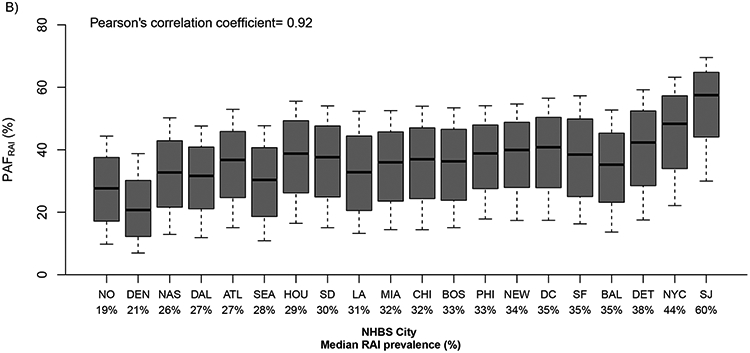
A) Model estimates of the contribution of RAI to new annual HIV infections due to RAI alone (PAFRAI) and due to RAI and riskier behaviours of RAI women (PAFRAI+Beh) overall and among those who do (ES) and do not exchange sex (No ES). b) PAFRAI in 20 US cities. Boxplots (median, and 10-90th percentiles) are shown in ascending order of city-specific median past-year RAI prevalence (Pearson’s correlation coefficient between RAI prevalence and median PAF across cities). City abbreviations are as in figure 1.