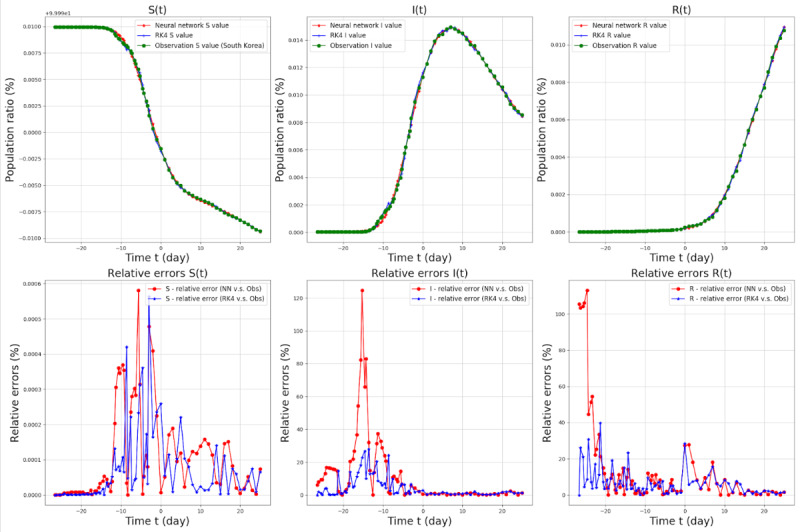
Figure 5.

SIR model target values and relative errors from February 7 (t=–26.6) to March 30 (t=25.0), 2020, in South Korea. The red lines in the top three graphs denote the Snet, Inet, and Rnet values for each graph, the green lines in the top and middle three graphs denote the observations, and the blue lines in the middle three graphs denote the RK4 results with the parameters βnet and γnet. The population ratio is the number of people in each group (S, I, and R) divided by the total number of people (N). Relative errors were defined as (|observed value − Network [or RK4] value|/|observed value|) × 100 and were calculated for each parameter. I: infected; R: recovered; RK4: Runge-Kutta fourth order method; S: susceptible.
