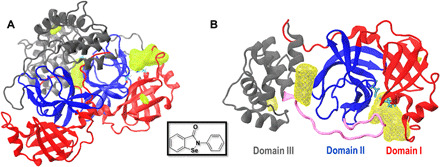
Fig. 1. Structure of Mpro and density maps of ebselen binding.

(A) Mpro dimer and (B) protomer A (top view). In both panels, Mpro domains I, II, and III are shown in red, blue, and gray, respectively. Cys145 and His41 (the catalytic dyad) are shown in cyan. Yellow surfaces show the most probable interaction sites between Mpro and ebselen (highest probability density). The loop (residues 185 to 201) connecting domains I and II with domain III is shown in pink (B). The inset shows the chemical structure of the ebselen molecule.
