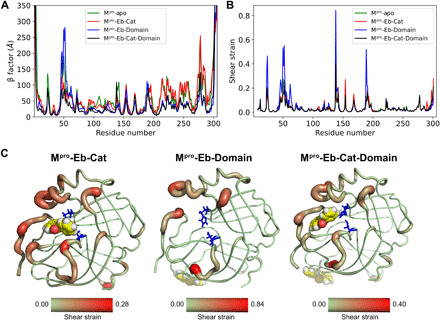
Fig. 3. Strain analysis of ebselen-Mpro complexes.

(A) β factor, estimated from the root mean squared fluctuation. (B) Shear strains. In both upper panels, Mpro-apo results are shown in green (Mpro-apo); for ebselen, when bound to the catalytic site (Mpro-Eb-Cat), results are in red. For the domain II–III interface (Mpro-Eb-Domain), results are shown in blue. For two ebselen molecules bound at both sites simultaneously (Mpro-Eb-Cat-Domain), results are shown in black. For the shear strain calculation, only the Cα atoms are included. (C) Shear strains mapped onto the different protein complexes from (B). The redder the region and the larger the radius of the structure, the higher the shear strain. For clarity, only the catalytic site and domains I and II are shown, the drug is shown as spheres, and the catalytic dyad is shown as blue sticks.
