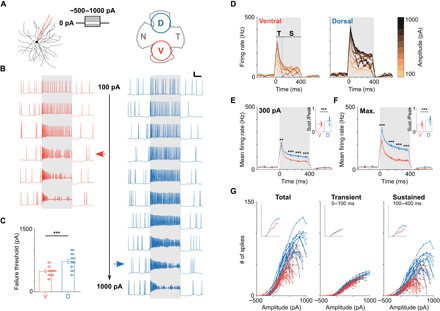
Fig. 1. Spiking responses are weaker in ventral versus dorsal OFF-α T RGCs.

(A) Left: Whole-cell patch clamp recordings were used to record the responses of OFF-α T RGCs to current injections (range, −500 to 1000 pA). Right: Schematic of the whole mount mouse retina depicting the approximate sampling locations for ventral (V) and dorsal (D) cells. (B) Representative current clamp recordings from OFF-α T RGCs in the ventral (red) and dorsal (blue) retina. Pulse duration was 400 ms (gray shading), amplitudes ranged from 100 to 600 pA (ventral) and 100 to 1000 pA (dorsal), respectively. Scale bar, 100 ms/20 mV. Horizontal arrows indicate failure threshold (see main text). (C) Comparison of failure threshold between ventral (red, n = 20) and dorsal (blue, n = 22) cells (495 ± 29 pA versus 718 ± 40 pA, P = 2 × 10⁻⁴). (D) Plots of firing rate versus time for all stimulus amplitudes tested; same cells as (B). Transient (T) and sustained (S) response phases correspond to 0 to 100 ms and 100 to 400 ms, respectively. (E) Mean firing rate over time across the population of ventral (red) and dorsal (blue) cells in response to a stimulus amplitude of 300 pA [two-way repeated measures analysis of variance (ANOVA): interaction, P = 0.0002; subgroups, P = 9 × 10⁻⁶]. (F) Same analysis as in (E) but for the amplitude that elicited maximum responses in each cell (two-way repeated measures ANOVA: interaction, P = 4 × 10⁻⁶; subgroups, P = 3 × 10⁻⁸). Insets in (E) and (F) show the ratio of sustained and peak firing rate for ventral (red) and dorsal (blue) cells. (G) The number of elicited spikes is plotted versus injected current amplitude for ventral (red) and dorsal (blue) cells for the whole duration of the injection (left), the initial 100 ms (middle), and the last 300 ms (right) of the stimulus. Insets show the population mean. **P < 0.01; ***P < 0.001.
