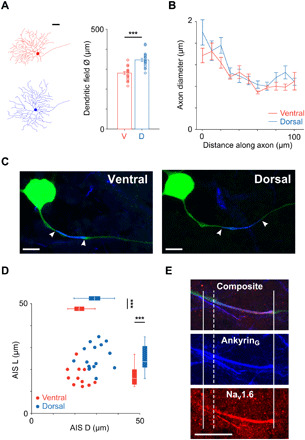
Fig. 2. AIS properties are different in ventral and dorsal OFF-α T RGCs.

(A) Left: Tracings of representative ventral (red; dendritic field diameter ~ 290 μm) and dorsal (blue; dendritic field diameter ~ 370 μm) cells. Scale bar, 50 μm. Right: Comparison of dendritic field diameter between ventral (red; n = 21) and dorsal (blue; n = 20) cells (280 ± 7 μm versus 347 ± 8 μm, P = 3 × 10⁻⁷). (B) Axon diameter was traced along the first 100 μm of the proximal axon in ventral (red; n = 13) and dorsal (blue; n = 17) cells (two-way repeated measures ANOVA: interaction, P = 0.8101; subgroups, P = 0.2336). (C) Confocal images of the soma and AIS from typical ventral (left) and dorsal (right) OFF-α T RGCs. Staining for AnkyrinG (blue) is overlaid with the axon (green); the start and end of the AIS are indicated by white arrowheads. Scale bars, 20 μm. (D) Scatter plot of AIS length (AIS L) versus AIS distance (AIS D) for ventral (red; n = 11) and dorsal (blue; n = 16) cells. Box plots reveal statistically significant differences for both distance (22.3 ± 1.2 μm versus 29.2 ± 1.2 μm, P = 0.0004) and length (16.9 ± 1.4 μm versus 25.5 ± 1.4 μm, P = 0.0003). (E) Immunochemical staining for AnkyrinG (blue) and Nav1.6 (red) along the proximal axon. Solid vertical lines indicate the start and end of the AnkyrinG staining; the dashed vertical line indicates the start of the Nav1.6 portion. Scale bar, 20 μm. ***P < 0.001.
