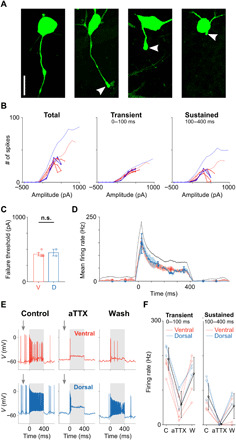
Fig. 3. Sustained firing is altered by disruption of AIS function.

(A) Confocal images of one cell with an intact axon (left) and three axotomized cells in the three rightmost panels. The severed edge of each axon is indicated by an arrowhead. Scale bar, 20 μm. (B) Number of spikes elicited for current injections in ventral (red; n = 4) and dorsal (blue; n = 2) cells that had their axons removed between the soma and the AIS. Three time periods were examined: (i) the full duration of the stimulus (left), (ii) the initial 100 ms (middle), and (iii) the final 300 ms of the stimulus (right). Population means of intact cells are shown by thin lines. (C) Comparison of failure thresholds between ventral (red; n = 4) and dorsal (blue; n = 2) cells that had axotomies between the soma and the AIS (425 ± 25 pA versus 450 ± 50 pA, P = 0.6328). n.s., not significant. (D) Mean firing rate over time across the population of axotomized ventral (red; n = 4), intact ventral (black; data from Fig. 1F), and dorsal (blue; n = 2) cells in response to a stimulus amplitude that elicited maximum responses in each cell. (E) Recordings before (left), during (middle), and after (right) the addition of aTTX (4,9-anhydrotetrodotoxin) (500 nM) to the perfusion bath for a ventral (red; top) and dorsal (blue; bottom) cell. (F) Comparison of peak/transient (left) and sustained (right) components of the response under control (C), during the application of aTTX, and after wash (W) in ventral (red; n = 4) and dorsal (blue; n = 3) OFF-α T RGCs. Population means are shown in black. Error bars represent one SD.
