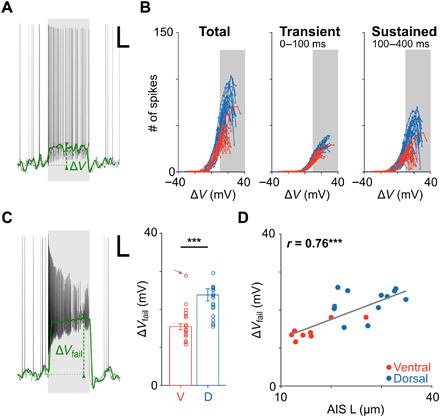
Fig. 4. Longer AISs facilitate higher levels of depolarization.

(A) Responses to current injection consisted of a series of action potentials “riding” on top of a change in the baseline membrane voltage (green); the change in V (from resting) is referred to as ΔV. Scale bar, 100 ms/10 mV. (B) Plots of the number of elicited spikes as a function of ΔV in ventral (red; n = 17) and dorsal (blue; n = 20) cells elicited during the full extent of the stimulus (left), during the initial response phase (middle), and during the sustained response phase (right). Gray shading indicates ΔV > 10 mV. (C) Left: ΔVfail was defined as the change in V at failure threshold. Scale bar, 100 ms/10 mV. Right: ΔVfail was significantly lower in ventral (red; n = 17) versus dorsal (blue; n = 20) cells (15.5 ± 0.8 mV versus 23.8 ± 1.6 mV, P = 4 × 10⁻⁵). One ventral cell was considered an outlier and excluded from analysis (gray arrow). (D) Each circle is a plot of ΔVfail versus AIS length for an individual ventral (red; n = 8) or dorsal (blue; n = 12) RGC. The gray line is the best-fit linear regression (P = 0.0001). ***P < 0.001.
