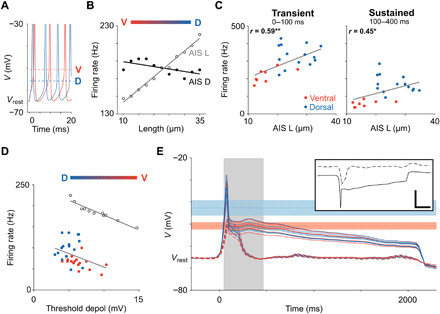
Fig. 7. Realistic models of AIS-specific spiking properties.

(A) Overlay of simulated spikes from the realistic model cell with short (10 μm; red) and long (35 μm; blue) AISs. Dashed horizontal lines indicate thresholds for spike initiation. (B) The influence of AIS L (unfilled circles) and AIS D (filled circles) on sustained firing rate in response to a somatic current injection of 300 pA. (C) Scatter plots of AIS length versus transient (left; P = 0.0036) and sustained firing rates (right; P = 0. 0347) from physiological experiments. The stimulus amplitude used was the one that resulted in the strongest responses in each cell. Solid lines in indicate best-fit linear regressions. *P < 0.05; **P < 0.01. (D) Firing rate in response to a 300-pA stimulus is plotted as a function of threshold depolarization for recorded data (red and blue correspond to ventral and dorsal cells, respectively) and simulated spike trains [black; data from (B)]. (E) Inset shows the input currents elicited during light stimulation in a typical ventral (dashed) and dorsal (solid) cell as measured by (9). Scale bar, 250 ms/500 pA. These currents were injected into the somas of model RGCs and the membrane voltage over time was plotted in ventral (red; n = 6) and dorsal (blue; n = 6) cells (main) with all voltage sensitive ion channels blocked. Red and blue horizontal shadings indicate failure threshold ± one SD as measured in ventral and dorsal RGCs, respectively. Gray shading indicates the 400-ms time window that was used in the current clamp experiments of Fig. 1.
