
Fig. 3. Identification of surface markers for the early-intermediate reprogramming cells.
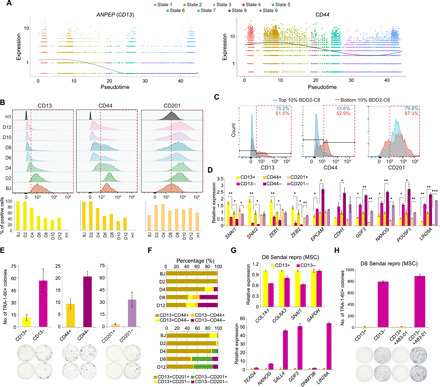
(A) Dotplots indicating the expression of ANPEP and CD44 along the pseudotime. Smooth lines are composed of multiple dots representing the mean expression level at each pseudotime, regardless of the state. (B) Stacked histograms (top) showing the fluorescence intensities (x axis) of the surface markers in the cells indicated on the left. Red dotted boxes highlight the positively stained populations. Quantifications are shown below. (C) Overlaid histograms showing the staining signals of the surface markers in the top 10% and bottom 10% BDD2-C8–stained cells. Red dotted boxes highlight the positively stained populations. The numbers on top indicate the percentages of positively stained cells. (D) Quantitative reverse transcription polymerase chain reaction (qRT-PCR) measuring the relative expression levels in the D8-sorted cells. n = 2; error bar indicates SD. * indicates P < 0.05; ** indicates P < 0.005; *** indicates P < 0.0005. (E) Quantification of TRA-1-60+ colonies yielded from the D8-sorted cells. Representative images are shown below. n = 2; error bar indicates SD. (F) Bar charts showing the distribution of costaining signals of the surface markers across the cells of various reprogramming time points. (G) qRT-PCR exhibiting the relative expression of the collagen/mesenchymal genes (top) and pluripotent genes (bottom) in the D8 CD13-sorted cells induced from MSC using Sendai virus. n = 2; error bar indicates SD. (H) Quantification of TRA-1-60+ colonies yielded from D8 CD13-sorted cells induced from MSC using Sendai virus (top). Representative images are shown below. n = 2; error bar indicates SD.