
Fig. 5. Stage-specific TF regulatory networks of reprogramming.
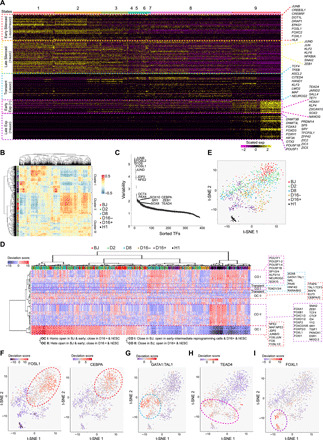
(A) Heatmap showing the TFs’ expression across the pseudotime states. Color code on top represents the pseudotime states. Representative TFs of each category are listed on the right. (B) Correlation between scATAC-Seq libraries based on the calculated JASPAR motif deviations in the HARs. Side color bar indicates time points of the scATAC-Seq libraries. (C) Plot indicating the significantly variable motifs in terms of accessibility in the scATAC-Seq libraries. y axis represents the variability score assigned to each JASPAR motif, whereas x axis represents the motif rank. (D) scATAC-Seq heatmap based on the deviation scores of the significantly variable JASPAR motifs. Color code on top represents time points. Motifs were classified to three major types according to the dynamics of accessibility across the time points. (E) t-SNE plot of scATAC-Seq libraries based on the deviation scores of JASPAR motifs. (F to I) Superimposition of motif enrichment scores for OC motifs FOSL1 and CEBPA (F), Transient motif GATA1:TAL1 (G), CO motifs: type I-TEAD4 (H); type II-FOXL1 (I) on the t-SNE plot. Colors indicate the motif accessibility levels.