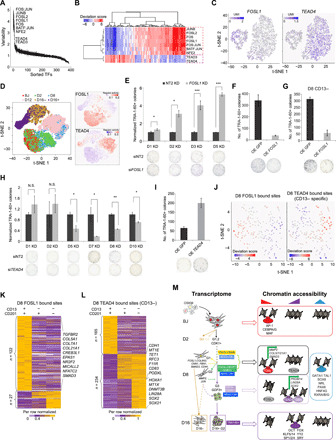
Fig. 6. TFs contributing to the heterogeneity in chromatin accessibility of the intermediate reprogramming cells.

(A) Plot indicating the significantly variable motifs in terms of accessibility in D8 cells. (B) Clustering of D8 scATAC-Seq libraries based on the accessibility of variable motifs. (C) Expression of FOSL1 and TEAD4 in the D8 CD13-sorted cells. (D) t-SNE plot based on the regulon activity matrix (left) and superimposition of regulon activities for FOSL1 and TEAD4 (right). (E) The number of normalized TRA-1-60+ colonies upon knockdown (KD) of FOSL1 at the indicated reprogramming time points. Representative images are shown below, n = 3. Error bar indicates SD. * indicates P < 0.05; *** indicates P < 0.0005. (F and G) Quantification of TRA-1-60+ colonies upon overexpression (OE) of FOSL1 in D5 cells (F) and D8 CD13− cells (G). Representative images are shown below, n = 3. Error bar indicates SD. (H) The number of normalized TRA-1-60+ colonies upon knockdown of TEAD4 at the indicated reprogramming time points. Representative images are shown below, n = 2. Error bar indicates SD. * indicates P < 0.05; ** indicates P < 0.005; N.S. indicates not significant. (I) Quantification of TRA-1-60+ colonies upon overexpression of TEAD4. Representative images are shown below, n = 3. Error bar indicates SD. (J) Clustering of D8 scATAC-Seq libraries based on the accessibility of FOSL1 and TEAD4 bound sites. (K and L) Heatmaps showing the expression of functional FOSL1 (K) and TEAD4 targets (L) in the D8 CD13 & CD201-sorted cells. (M) Proposed model of the study.
