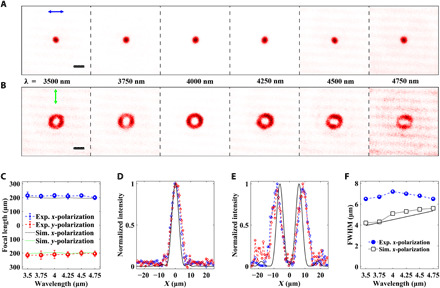
Fig. 3. Performance of the BAFOV generator.

(A and B) Measured transverse intensity distributions along the black dotted line shown in Fig. 2B for each sampled wavelength. (A) is for x-polarization and (B) is for y-polarization. Scale bars, 15 μm. (C) Simulated and measured focal lengths as a function of wavelength. The error bars show the distance variations from the focal plane where the intensity of the focal spot remains the maximum value in the measurement. (D and E) Normalized horizontal- (blue dashed line) and vertical (red dashed line) cut intensity profiles of the focal spots shown in (A) and (B) at λ = 4000 nm, respectively. The content in the main text is also modified below. The black solid lines represent the corresponding simulated results. (F) Full width at half maximums (FWHMs) of the focal spots shown in (A) versus the sampled wavelengths. The solid line represents the corresponding theoretical diffraction limits. Exp., experiment. Sim., simulation.
