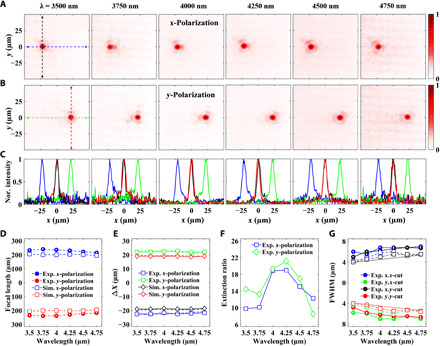
Fig. 5. Transverse intensity distributions and characterizations of the BAFS.

(A and B) Measured focal plane intensity distributions are shown in Fig. 4B at each sampled wavelength for (A) x-polarization and (B) y-polarization. (C) Horizontal and vertical cuts [shown the dashed lines in (A) and (B)] across the measured focal spots for x-polarization (blue and black curves) and y-polarization (green and red curves) for the sampled wavelengths. Nor., normalized. (D) Measured and simulated focal lengths as a function of wavelength for both polarizations. (E) Measured and simulated horizontal shifts (ΔX) of the focal spots from the center for x- and y-polarized incidence at selected wavelengths. The dashed lines demonstrate the corresponding theoretical values (±F × tan Θ0) for comparisons. “F” is the corresponding focal length extracted in (D). (F) Measured extinction ratio at each sampled wavelength. (G) Extracted FWHMs of the focal spots along horizontal- and vertical-cut lines for x- and y-polarization in (C). Dashed curves represent the corresponding simulated results, and dotted straight lines represent the theoretical limits.
