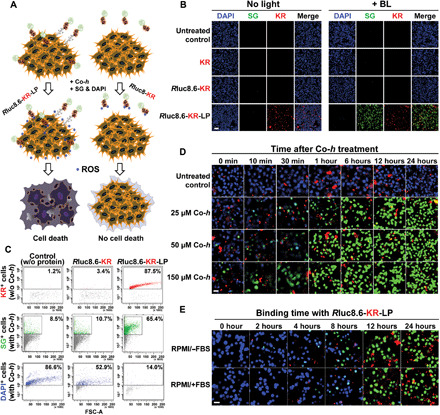
Fig. 2. Cytotoxic effect of BLiP-PDT in MCF-7 cells.

(A) Schematic of targeted cancer therapy using BLiP-PDT with Rluc8.6-KR-LP (left) or Rluc8-KR (right). (B) Fluorescence confocal images of protein-untreated or protein-treated cells without light and with Co-h for BL. Images were obtained after sequential treatment with SG and DAPI. Multiple colors were obtained from DAPI [blue; ex, 360 nm], SG (green; ex, 504 nm), and KR (red; ex, 585 nm). Scale bar, 100 μm. (C) Quantitative FACS analysis of KR-binding cell populations (top) and dead (SG-positive, center) and live (DAPI-positive, bottom) cell populations. All conditions were similar to those of (B). (D) Fluorescence confocal images of MCF-7 cells with 10 μM Rluc8.6-KR-LP at 37°C for 24 hours over time (0 to 24 hours) after Co-h treatment at different concentrations (final, 0 to 150 μM). Images at various incubation times were obtained after sequential treatment with SG and DAPI. Scale bar, 20 μm. (E) Fluorescence confocal images of MCF-7 cells over time (0 to 24 hours) after binding with 10 μM Rluc8.6-KR-LP in FBS-free (top) and FBS-containing (bottom) RPMI medium. Co-h (final, 150 μM) was added to the protein-treated cells and incubated for 30 min at 37°C to ensure ROS generation. Images were obtained after sequential treatment with SG and DAPI. Scale bar, 20 μm.
