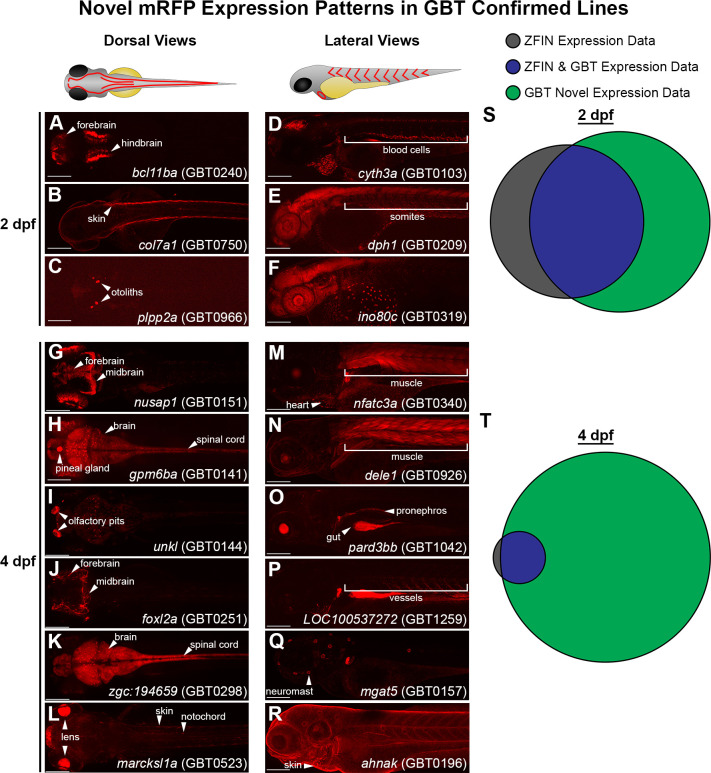
Figure 7. GBT protein trap elucidates novel gene expression patterns in embryonic and larval zebrafish.
(A–C) Dorsal views of 2 days post-fertilization (dpf) embryos with GBT protein trap mRFP expression patterns ranging from bcl11ba in the forebrain and hindbrain (A), to col7a1 in the skin (B), and plpp2a in the otoliths (C). (D-F) Lateral views of 2 dpf embryos with GBT protein trap mRFP expression patterns ranging from cyth3a in blood cells (D), to dph1 in somites (E), and ino80c around the yolk (F). (G–L) Dorsal views of GBT protein trap mRFP expression patterns in 4 dpf larvae including nusap1 in the forebrain and midbrain (G), gpm6ba in the brain, spinal cord, and pineal gland (H), unkl in the olfactory pits (I), foxl2a in the forebrain and midbrain (J), zgc:194659 in the brain and spinal cord (K), and marcksl1a in the lens, skin, and notochord (L). (M–R) Lateral views of GBT protein trap mRFP expression patterns in 4 dpf larvae including nfatc3a in heart and muscle (M), dele1 in muscle (N), pard3bb in the gut and pronephros (O), LOC100537272 in vessels (P), mgat5 in neuromasts (Q), and ahnak in skin (R). Scale bars = 200 µm. (S–T) Area proportional Venn diagrams of 193 genes trapped in GBT-confirmed lines comparing the ZFIN-assembled database with mRFP expression in GBT lines available through zfishbook at two dpf (S) and four dpf (T). 67 (35%) and 174 (90%) of 193 genes trapped in GBT-confirmed lines have no description about wild-type expression at 2 dpf and 4 dpf, respectively.

