. 2020 Aug 24;9:e55792. doi: 10.7554/eLife.55792

Figure 2. Incomplete 3' UTRs annotations contribute to discrepancies in RNA-seq analysis.

(A, B) Log10 average expression as quantified using indicated annotation for (A) kdrlpos- or (B) pdgfrbpos-enriched genes identified as such only in RefSeq and lacking an Ens95 3' UTR annotation. Expression levels for genes from each annotation with matched NCBI ID are shown in each case. Data are normally distributed (Shapiro-Wilks test), paired t-test, p values are indicated; n = 3 (i.e. each point represents an average value from three separate RNA-seq replicates). (C) UCSC browser image of slc7a5 locus on the minus strand showing 3' UTR annotations from Ens95 and RefSeq. Mapped read depth from kdrlpos cells on the genome, or assigned to each annotation are indicated, as is a 3P-seq feature. The GSE32900 track is consolidated RNA-seq reads from all stages indicated in Figure 3A. The location of a putative missing 3' UTR is indicated. (D) Pie chart showing numbers of reference genes with the same or longer 3' UTRs in each indicated annotation. (E) Pie charts showing the proportion of reference genes selectively identified as kdrlpos- or pdgfrbpos-enriched by Ens95 and RefSeq with indicated relative 3' UTR length. (F, G) Correlation plots showing log10 average expression from kdrlpos RNA-seq (n = 3) quantified with each annotation for matched reference genes with (F) longer Ens95 (maroon) or RefSeq (light blue) 3' UTR, or (G) same 3' UTR length. Data are not normally distributed, Spearman correlation, r values are indicated. (H, I) UCSC browser images of (H) sox17 and (I) cspg4 loci, both on the minus strand, showing 3' UTR annotations from Ens95 and RefSeq. Mapped read depth of RNA-seq from (H) kdrlpos or (I) pdgfrbpos cells captured for each annotation is indicated. Consolidated reads from GSE32900 and location of 3P-Seq features are indicated, as is putative missing 3' UTR in cspg4.

Figure 2—source data 1. Missing 3' UTR annotations in RefSeq and Ens95.
This file includes lists of Ens95 (worksheet 1) and RefSeq (worksheet 2) genes indicating annotation as coding sequence (CDS) and whether there is an annotated stop codon and 3' UTR. Data from RNA-seq-based quantification for Ens95 genes missing a 3' UTR that is present in RefSeq is included for kdrlpos (worksheet 3), pdgfrbpos (worksheet 4), and Nr2f2pos (worksheet 5) cells. These data were used to generate Table 2 and graphs in Figure 2A,B; Figure 2—figure supplement 2I.
Figure 2—source data 2. Reference gene set for 3' UTR comparisons.
IDs for representative Ens95, RefSeq, and V4.3 transcript ID, along with V4.3 gene symbols are shown with respective 3' UTR lengths (worksheet 1). Average median ratio normalized expression and log2 fold change (pos/neg) values quantified with Ens95, RefSeq, and V4.3 annotations from kdrlpos (worksheet 2), pdgfrbpos (worksheet 3), and Nr2f2pos (worksheet 4) RNA-seq for reference genes are included. Data directly used to generate Figure 2D–G, Figure 2—figure supplement 2C–H, Figure 3B–J and incorporated into source data as indicated below.
Figure 2—source data 3. RNA-seq analysis of Nr2f2pos and NR2f2neg cells.
Output from DESeq2 analysis comparing Nr2f2pos and Nr2f2neg RNA-seq from gene expression levels quantified using RSEM with Ens95 (worksheet 1) or RefSeq (worksheet 2). Median ratio normalized expression values are shown for each sample, along with adjusted p-value, p-value, log2 fold change, fold change, and log10 adjusted p-value. Intersection of genesets identified as significantly enriched in Nr2f2pos cells using Ens95 or RefSeq (worksheet 3).
Figure 2—source data 4. Transcript based-comparison of RefSeq and Ensembl annotations.
Worksheet one is a list of Ens95 genes missing from RefSeq with Ensembl gene ID, matching ZFIN ID and biotype annotation. Worksheet two is a list of RefSeq genes missing from Ensembl with NCBI gene ID, matching ZFIN ID, and coding sequence annotation. Transcript level matching output from gffcompare is included using Ens95 (worksheet 3) or RefSeq (worksheet 4) as a reference. Worksheet five is a transcript level comparison of Ens95 and Ens99. In this case, all transcripts exhibit a complete intron/exon chain match (designated by a ‘=" in class code). Data used to generate Table 3.

Figure 2.

Figure 2—figure supplement 1. Differences in 3' UTR lengths between Ens95 and RefSeq for discrepant kdrlpos- and pdgfrbpos-enriched genes.

Figure 2—figure supplement 1.

(A, B) Plots showing 3' UTR length from matched reference genes from indicated annotation identified as enriched only in Ens95 or RefSeq. Mean 3' UTR length for each group is shown, error bars denote mean and standard deviation. No statistical comparison is presented since these data are already defined as longer (>50 nt) in indicated annotation. (A) kdrlpos-enriched genes. (B) pdgfrbpos-enriched genes.
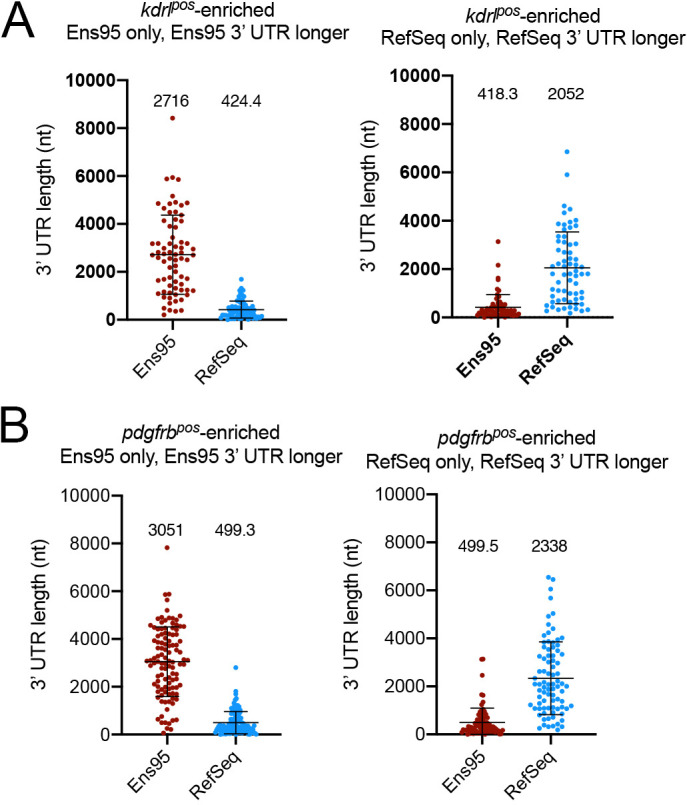
Figure 2—figure supplement 2. Analysis of RNA-seq reads from a random-primed library.

Figure 2—figure supplement 2.

(A,B) Volcano plots of differentially expressed genes from Nr2f2-positive and -negative (Nr2f2pos and Nr2f2neg) endothelial cells identified using RNA-seq reads quantified with (A) RefSeq or (B) Ensembl, version 95 (Ens95) transcript annotations. Genes with significant enrichment (padj <0.05) are shown as red or blue (log2 fold change >1 or <-1, respectively). Grey dots are genes that fall below statistical cutoffs. (A, B) Green dots are selected known vein-specific genes. (C) Venn diagram of genes with a common NCBI ID in Ens95 and RefSeq identified as significantly Nr2f2pos-enriched using either annotation. (D) Correlation of log10 average expression levels (n = 3) from indicated annotation for Nr2f2pos-enriched genes identified selectively as such by Ens95 or RefSeq only (left plot) or both annotations (right plot). Data are not normally distributed, Spearman correlation, r values are indicated. (E) Log10 average expression (n = 3) for Nr2f2pos-enriched genes as quantified by each indicated annotation. Separate plots shown for genes selectively identified as Nr2f2pos-enriched using Ens95 or RefSeq. Data are not normally distributed, Wilcoxon matched-pairs signed-rank test, p values are indicated. (F) Plots of commonly annotated genes identified as Nr2f2pos-enriched only by Ens95 with indicated values from Ens95 (left plot) or RefSeq (right plot). (G) Pie charts showing the proportion of reference genes identified as Nr2f2pos-enriched by Ens95 and RefSeq with indicated relative 3' UTR length. (H) Correlation of log10 average expression from Nr2f2pos RNA-seq (n = 3) quantified with each annotation for matched reference genes with same 3' UTR length or longer Ens95 or RefSeq 3' UTR length. Data are not normally distributed, Spearman correlation, r values are indicated. (I) Log10 average expression (n = 3) as quantified by Ens95 or RefSeq for Nr2f2pos-enriched genes lacking an Ens95 3' UTR annotation. Data are not normally distributed, Wilcoxon matched-pairs signed-rank test, p value is indicated. (J) UCSC browser image of the erg gene (on minus strand) showing 3' UTR annotation and lack thereof from RefSeq and Ens95, respectively. Mapped depth of RNA-seq reads from Nr2f2pos cells captured for each annotation is indicated. Genome-mapped consolidated reads from GSE32900 are also shown as is the location of 3P-seq feature, also on the minus strand.