. 2020 Aug 24;9:e55792. doi: 10.7554/eLife.55792

Figure 4. The V4.2 annotation increases the number of cells and clusters detected in single cellingle-cell RNA-seq analysis.

(A, B) tSNE plots of cells from 5 day post fertilization (dpf) zebrafish embryos from the same mapped scRNA-seq reads quantified with (A) Ens95 or (B) V4.2. The total number of clusters and cells that passed filtering are shown. Clusters of interest noted in the text are named. Cartilage and epidermis clusters are circled. (C, D). tSNE plots showing restricted expression of (C) mia in cartilate cells and (D) and1 in epidermis cells for both Ens95 and V4.2 annotations. Each cluster is indicated by a circle. Legends indicate log-transformed and normalized expression values.

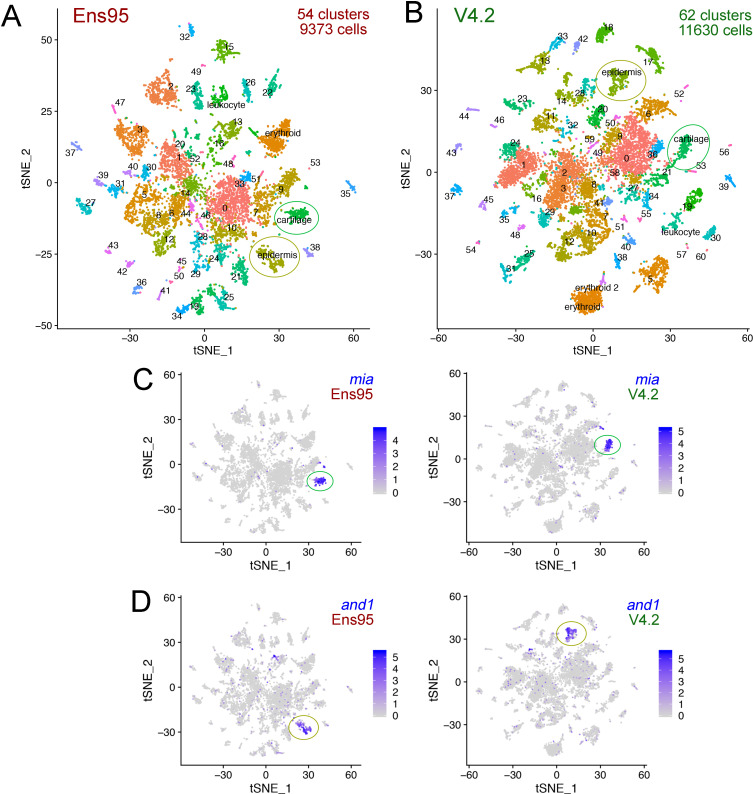
Figure 4—source data 1. Metrics from CellRanger output for data quantified using Ens95 and V4.2.
Figure 4—source data 2. Cluster-specific genes from whole embryo scRNA-seq at 5 days post fertilization (dpf) identified using Seurat from data quantified with Ens95.
The p-value, adjusted p-value, and average log2 fold change refer to comparison of indicated cluster with all other clusters. Cutoffs are adjp <0.05, log2 fold change >0.5. Pct.1 is proportion of cells within indicated cluster that express detectable levels of the indicated gene. Pct.2 is proportion of all other cells that express detectable levels of the indicated gene. Matching LL and Ensembl gene IDs are included.
elife-55792-fig4-data2.xlsx (845.2KB, xlsx)
Figure 4—source data 3. Cluster-specific genes from whole embryo scRNA-seq at five dpf identified using Seurat from data quantified with V4.2.
p-value, adjusted p-value and average log2 fold change refer to comparison of indicated cluster with all other clusters. Cutoffs are adjp <0.05, log2 fold change >0.5. Pct.1 is proportion of cells within indicated cluster that express detectable levels of the indicated gene. Pct.2 is proportion of all other cells that express detectable levels of the indicated gene. Matching LL and Ensembl gene IDs are included.

Figure 4.

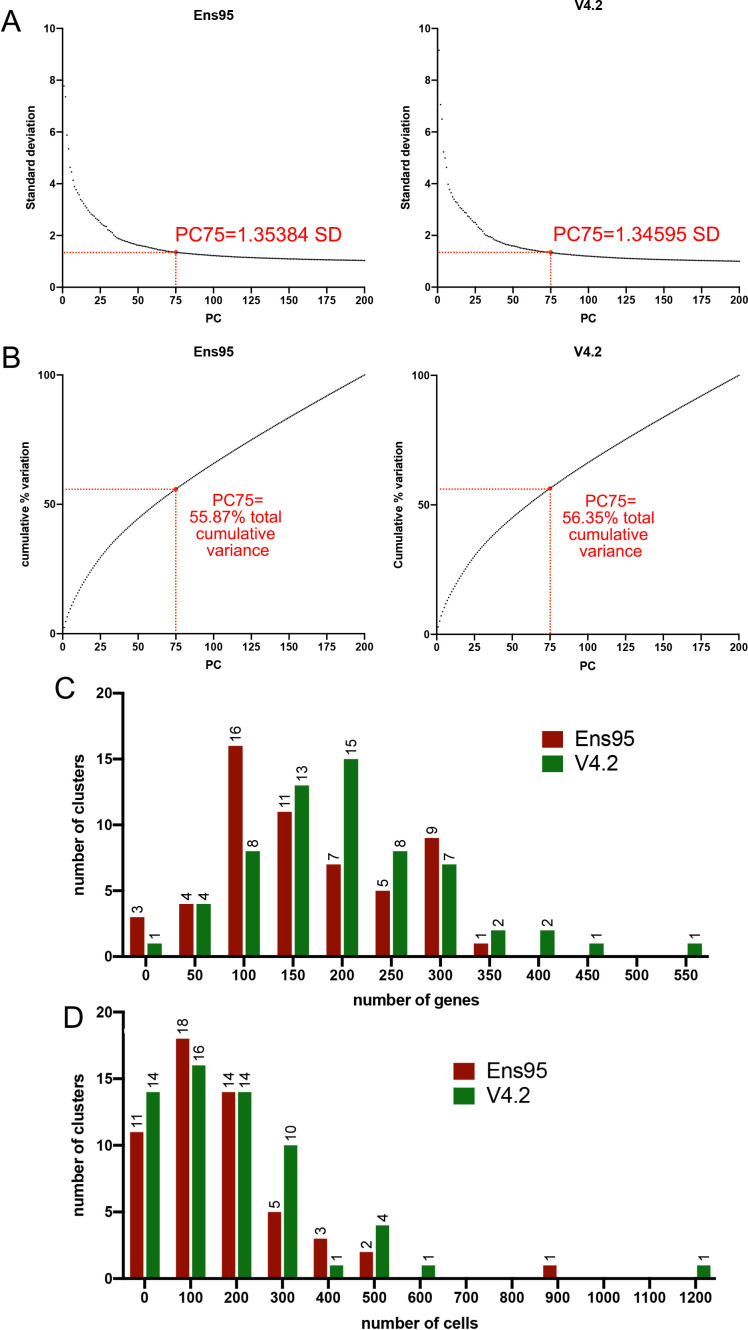
Figure 4—figure supplement 1. Standard variance and principal component comparisons for scRNA-seq analysis.

Figure 4—figure supplement 1.

(A) Plots of standard deviation against the number of principal components using whole embryo scRNA-seq data quantified using indicated annotation. Standard deviation values for 75 principal components are shown in both cases. (B) Plots of cumulative variation against the number of principal components from scRNA-seq data quantified using indicated annotation. Total cumulative variance values for 75 principal components are shown in each case. (C) Histogram plot of the number of genes per cluster. The bin size is 50. No clusters have 0 genes. (D) Histogram showing the number of cells per cluster. The bin size is 100. No clusters have 0 cells.
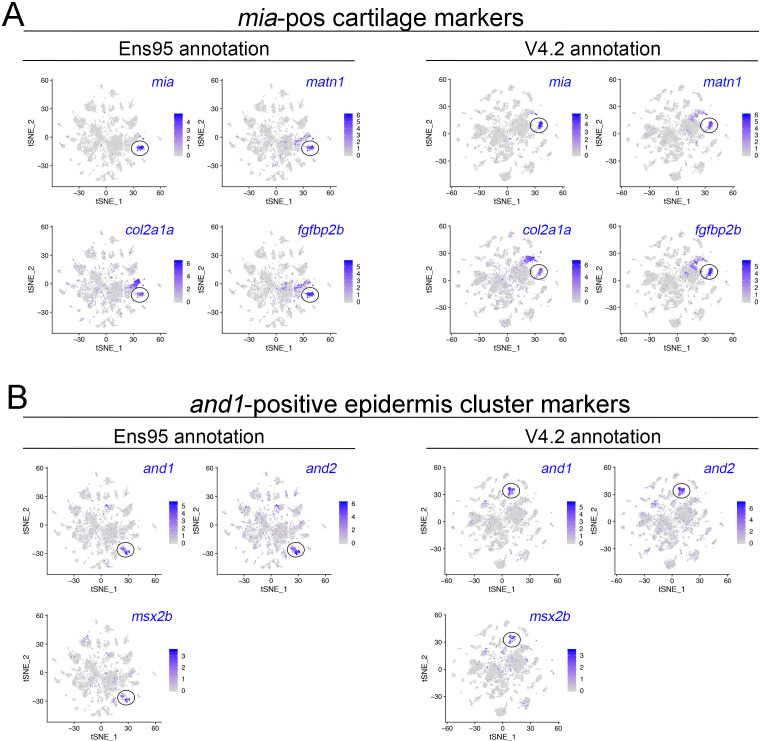
Figure 4—figure supplement 2. Identification of cartilage and epidermis cell clusters in scRNA-seq data.

Figure 4—figure supplement 2.

(A) tSNE plots showing expression of cartilage markers mia, matn1, col2a1a, and fgfbp2 using clustering based on data quantified with Ens95 or V4.2, as indicated. (B) tSNE plots showing expression of epidermis markers and1, and2, and msx2b using clustering based on data quantified with Ens95 or V4.2, as indicated. (A, B) Legends indicate log-transformed normalized expression level per cell.