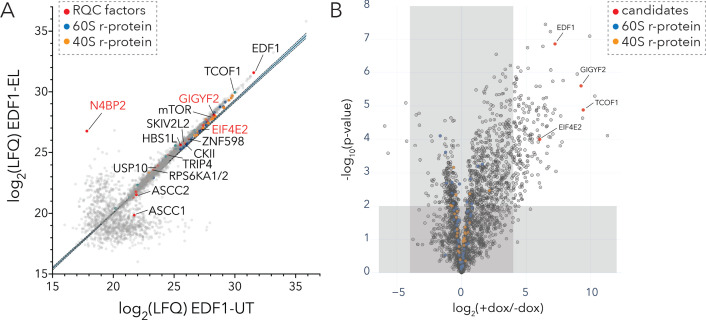
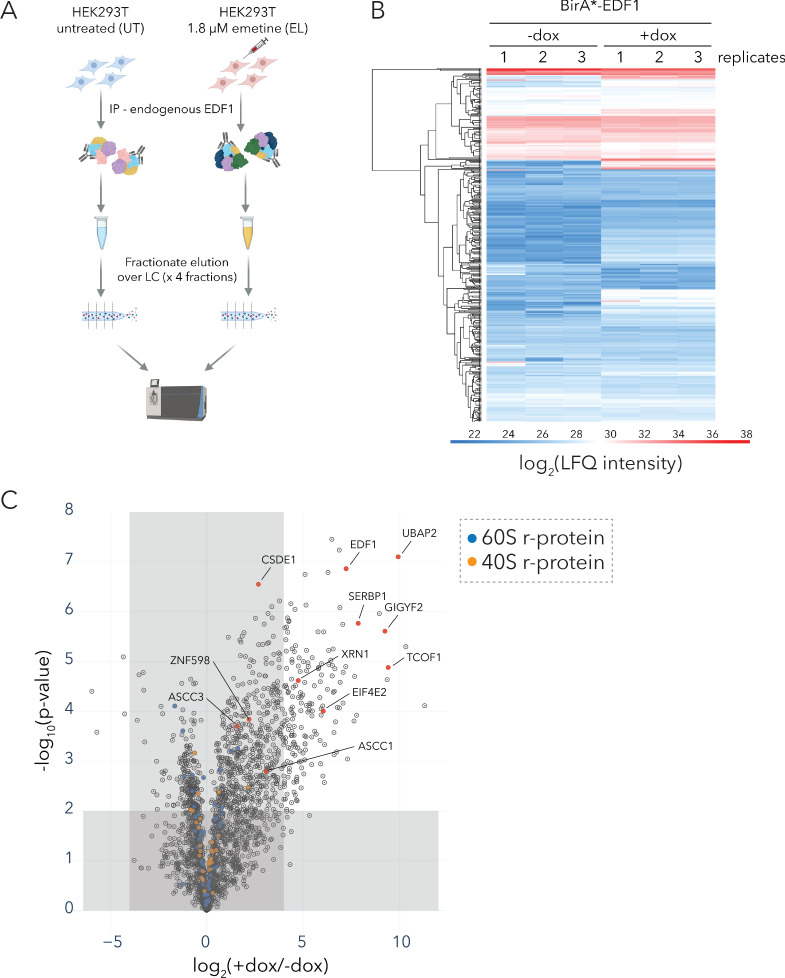
Figure 5. Interaction analyses of EDF1 under basal growth and ribotoxic-stress conditions.
(A) Immunoaffinity purification of endogenous EDF1 from untreated (UT) or low dose emetine treated (EL; 1.8 µM, 15 min) HEK293T cells using Protein A-coupled EDF1-antibody. Scatter plot showing log2(LFQ) intensity of proteins identified under EL (y-axis) and UT (x-axis) conditions. (B) BioID analyses of BirA*-EDF1 with and without doxycycline induction. Volcano plot of fold change in protein LFQ intensity with or without BirA*-EDF1 expression induction by doxycycline (dox). Selected candidates highlighted in red. A cutoff of (+dox/-dox) ≥16 fold and p-value ≤ 0.01 was set to eliminate known BioID contaminants. See also Figure 5—figure supplement 1, Figure 5—source data 1, and Figure 5—source data 2.


