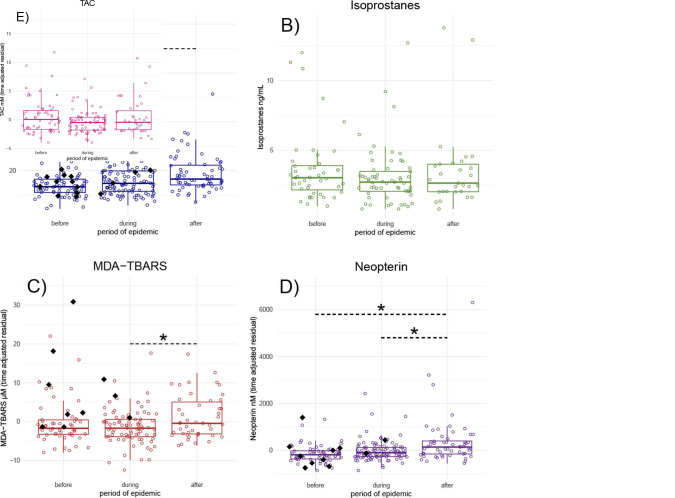
Fig 2.
Variation in concentrations of A) 8-OHdG, B) F-Isoprostanes, C) MDA-TBARS, D) neopterin, and E) Total antioxidant capacity before, during, and after a severe respiratory epidemic. Points are individual sample-day concentrations. Black diamonds are sample-days from any of the 5 individuals that died during the epidemic. Boxes represent median and interquartile ranges of concentrations. Horizontal dashed lines indicate significant contrasts in biomarker concentrations between periods determined by generalized linear mixed effects models. For N individuals and samples per biomarker see S1 Table.

