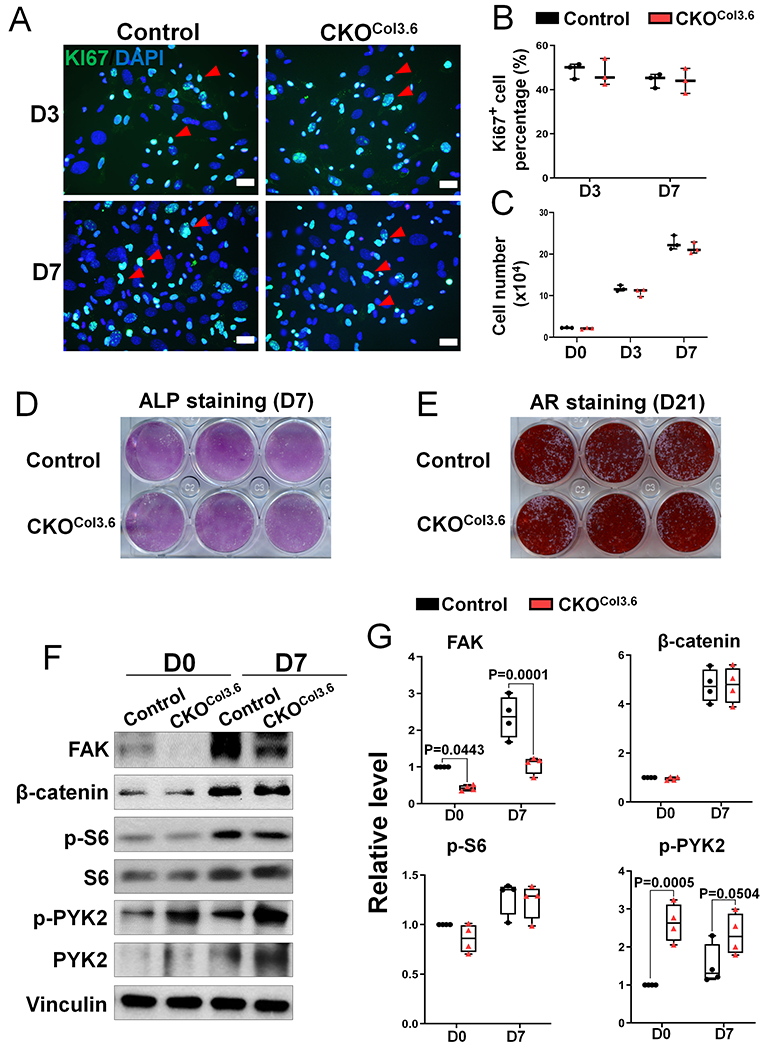
Figure 7. Fak deletion in osteoblasts does not affect proliferation and mTORC1 activity.

(A) Representative fluorescent images of Ki67 (green) and Dapi (blue) staining in Fakflox/flox (Control) and Fakflox/flox;Col3.6-Cre (CKOCol3.6) BMSCs after 3 and 7 days culture. Red arrow heads point to the Ki67+DAPI+cells. Scale bar=20 μm. (B) Quantification of the percentage of Ki67-positive BMSCs described in (A) (n=3). (C) Quantification of BMSC cell number in the same culture as (A) (n=3). (D) Alkaline phosphatase (ALP) staining was performed after 7 days osteogenic culture of control and CKOCol3.6 BMSCs. Image was the representative of 6 independent experiments. (E) Alizarin red (AR) staining was performed after 21 days osteogenic culture of control and CKOCol3.6 BMSCs. Image was the representative of 6 independent experiments. (F-G) Western blot was performed on lysates of BMSCs isolated from Fakflox/flox (Control) and Fakflox/flox;Col3.6-Cre (CKOCol3.6) mice: (F) Representative western blot image using indicated antibodies in day 0 (first day after plating) and day 7 cultures; (G) Quantification of the relative protein levels as illustrated in (E). FAK and β-catenin were normalized to Vinculin and phospho-proteins were normalized to the respective total proteins (n=4). Values were presented as median and interquartile range.
