
Figure 1.
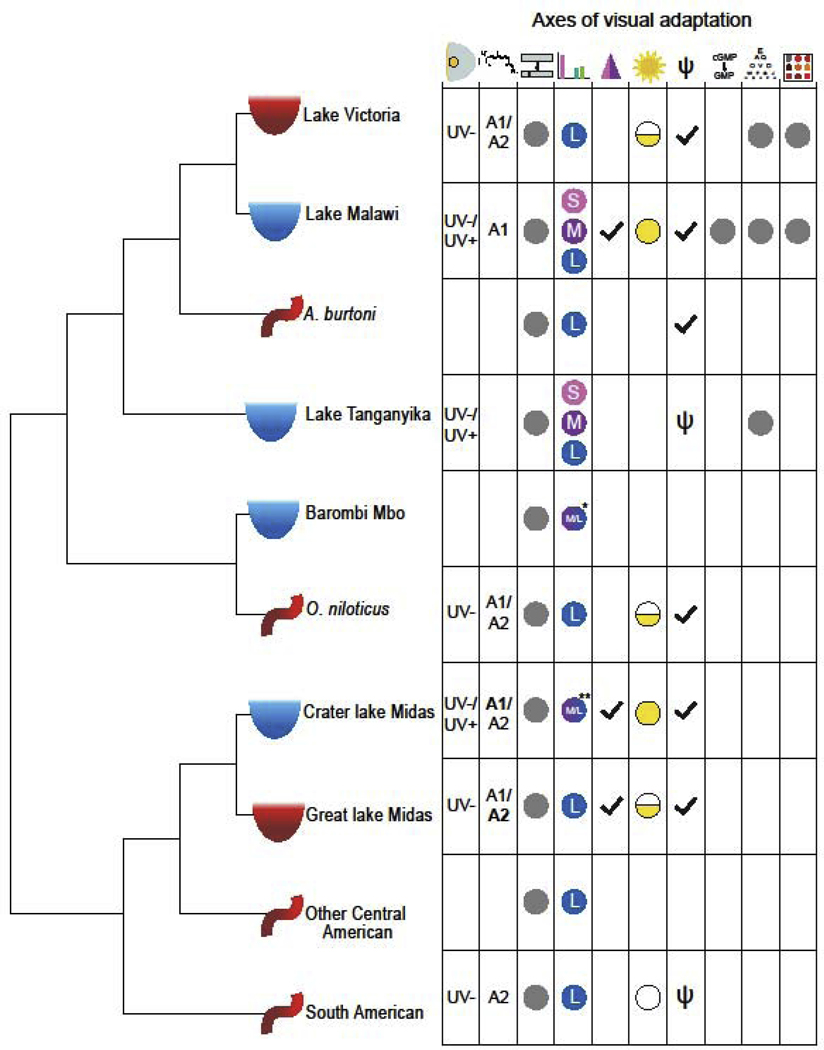
Cichlid phylogeny showing the ecological and geographic diversity and the corresponding diversity of visual tuning mechanisms. Icons noted on the phylogeny show the habitat of each species or group: turbid lakes (red semi-circle), clear lakes (blue semi-circle), and rivers (red curved line). Icons across the top show axes of visual adaptation from left to right: lens and cornea transmission, chromophore, opsin coding sequence, opsin expression, coexpression, environmental plasticity, gene loss, phototransduction, visual acuity, and color sensitivity and discrimination. Grey dots or symbols denote that this axis has been investigated in this group on some level, blank spaces denote areas needing further study. Results for some axes are shown. Symbols: Lens and cornea type are UV transmissive (UV+) or blocking (UV-); Chromophore type (A1 or A2 with predominant in bold); Adult opsin expression palettes are short (S), medium (M), and long (L); Coexpression presence (checkmark); Plasticity demonstrated for development (half-circle), development and adults (filled circle), or absent (empty circle); Opsin gene complement is full (checkmark) or has gene loss (psi). *Some Barombi Mbo species express a dichromatic palette that differs from the typical trichromatic palettes. **Some crater lake Midas cichlids have expression midway between M and L.