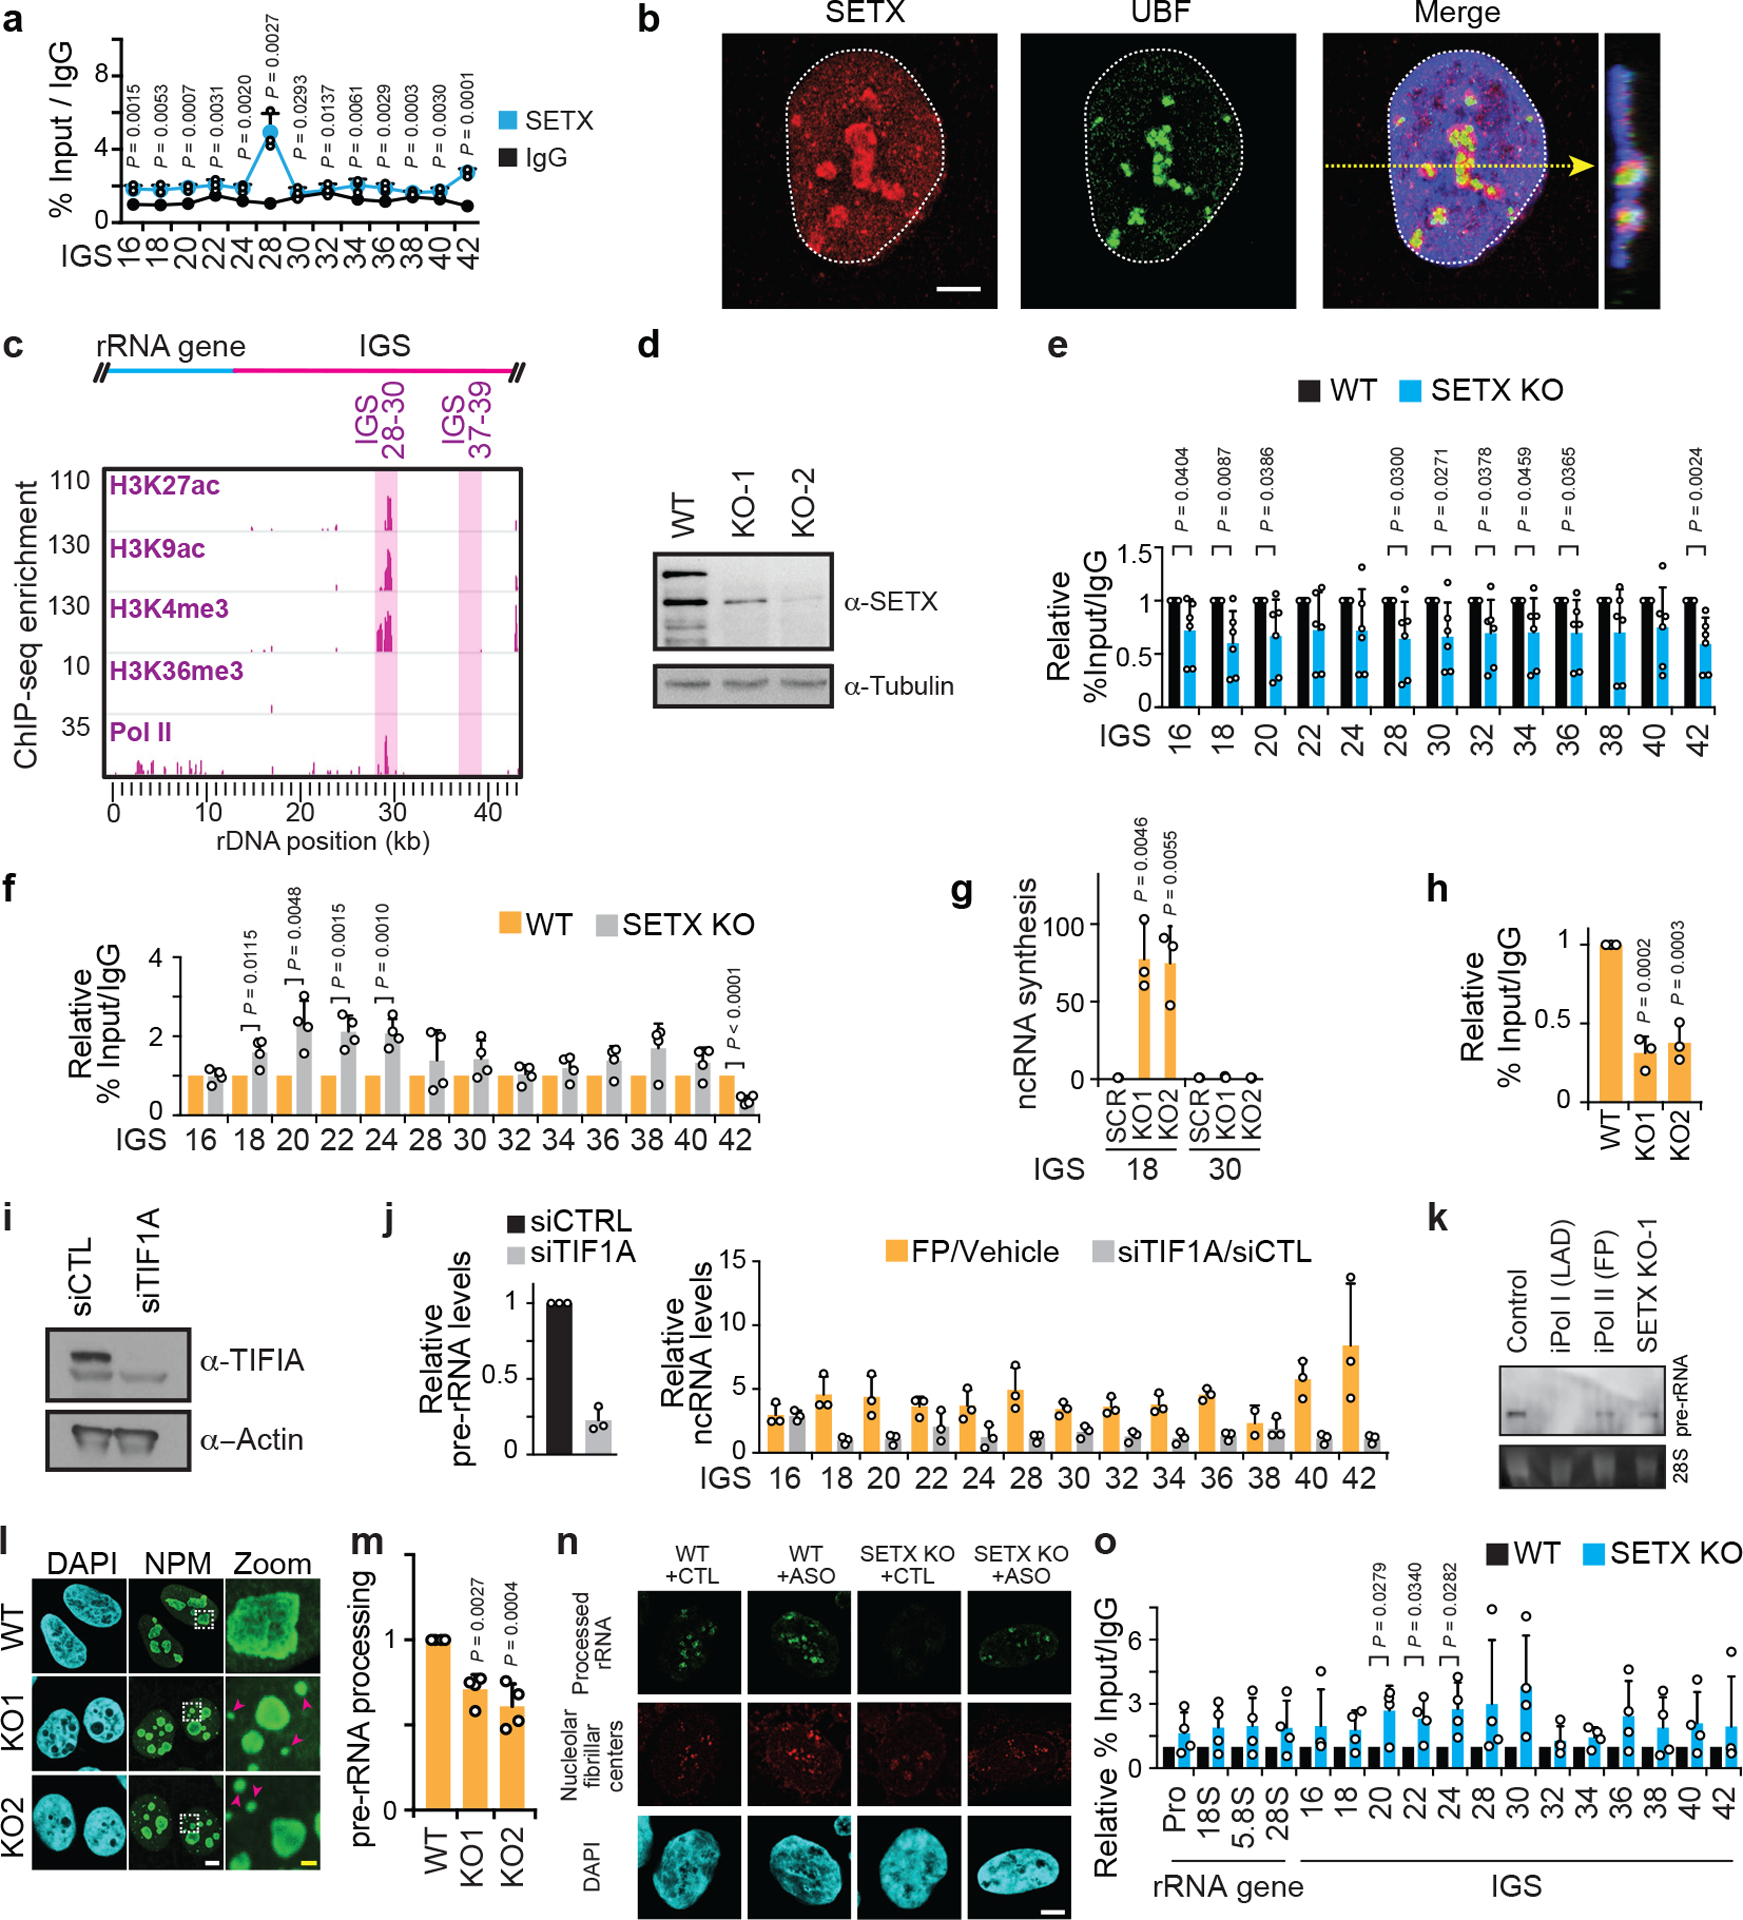
Extended data Fig. 8 |. Nucleolar and IGS features of wild-type and SETX KO cells.

(a) ChIP showing SETX enrichment at the IGS. (b) SETX had a nucleolar/nucleoplasmic localization. (c) Bioinformatic analysis of ENCODE-K562 data showing co-enrichment of epigenetic marks consistent with transcriptional activation near IGS28. (d) Immunoblot showing CRISPR/Cas9-mediated SETX KO. (e) ChIP showing Pol II enrichment across rDNA in wild-type and SETX KO cells. (f) ChIP reveals that SETX KO, in two clones, enriched RNA Pol I at the IGSs. (g-h) SETX KO induced IGS ncRNA synthesis (g) and decreased Pol I enrichment at the rRNA gene (5’ETS region) (h). (i-j) siRNA-mediated knockdown of TIF1A lowered Pol I-dependent pre-rRNA levels but failed to induce IGS ncRNAs. For experimental design differences, FP/Vehicle data (j) were from a different experiment (extended data Fig. 6d) but are shown here on the same graph for better visual comparison. (k) Northern blotting revealed that Pol II or SETX disruption did not induce rRNA gene read-through transcripts. Probe for the 5’-ETS of pre-rRNA was used. (l-m) SETX KO disrupted nucleolar organization as indicated by NPM immunofluorescence (e) and decreased pre-rRNA processing in pulse-chase assays (f). (n) ASO-mediated knockdown of sincRNAs increases rRNA biogenesis, as indicated by single cell rRNA biogenesis assays. Shown are nucleolar fibrillar centre-associated RNA rings revealed by single-cell FU-RNA pulse-chase immunofluorescence. Quantification shown in Fig. 4e. (o) ChIP showing H3K9me2 enrichment across rDNA in wild-type and SETX KO cells. (a-o) HEK293 cells were used unless otherwise indicated. Data in (e,o) were from large experimental sets sharing IgG controls. Data are shown as the mean±s.d.; two-tailed t-test, n=3 biologically independent experiments (a, j), n=6 biologically independent experiments (e), and n=4 biologically independent experiments (f, o); one-way ANOVA with Dunnett’s multiple comparisons test, n=3 biologically independent experiments (g,h) and n=4 biologically independent experiments (m); images in (b-d,k) are representative of two independent experiments. Scale bars, 5 μm. For gel source data (d, i, k), see Supplementary Figure 1.
