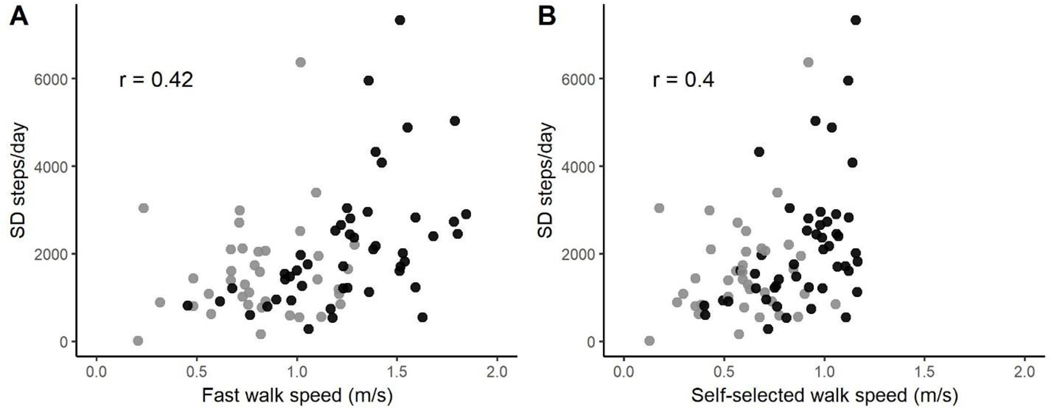
Figure 2.
Relationships between walking speed and standard deviation of steps per day. A: Fastest walking speed; B: self-selected walking speed. Black circles = PD participants, gray circles = participants with stroke. Note that an inclusion criterion of the study was self-selected walking speed ≤ 1.2 m/s, so no one has a value above that in panel B. For correlations coefficients, p < 0.0001.

