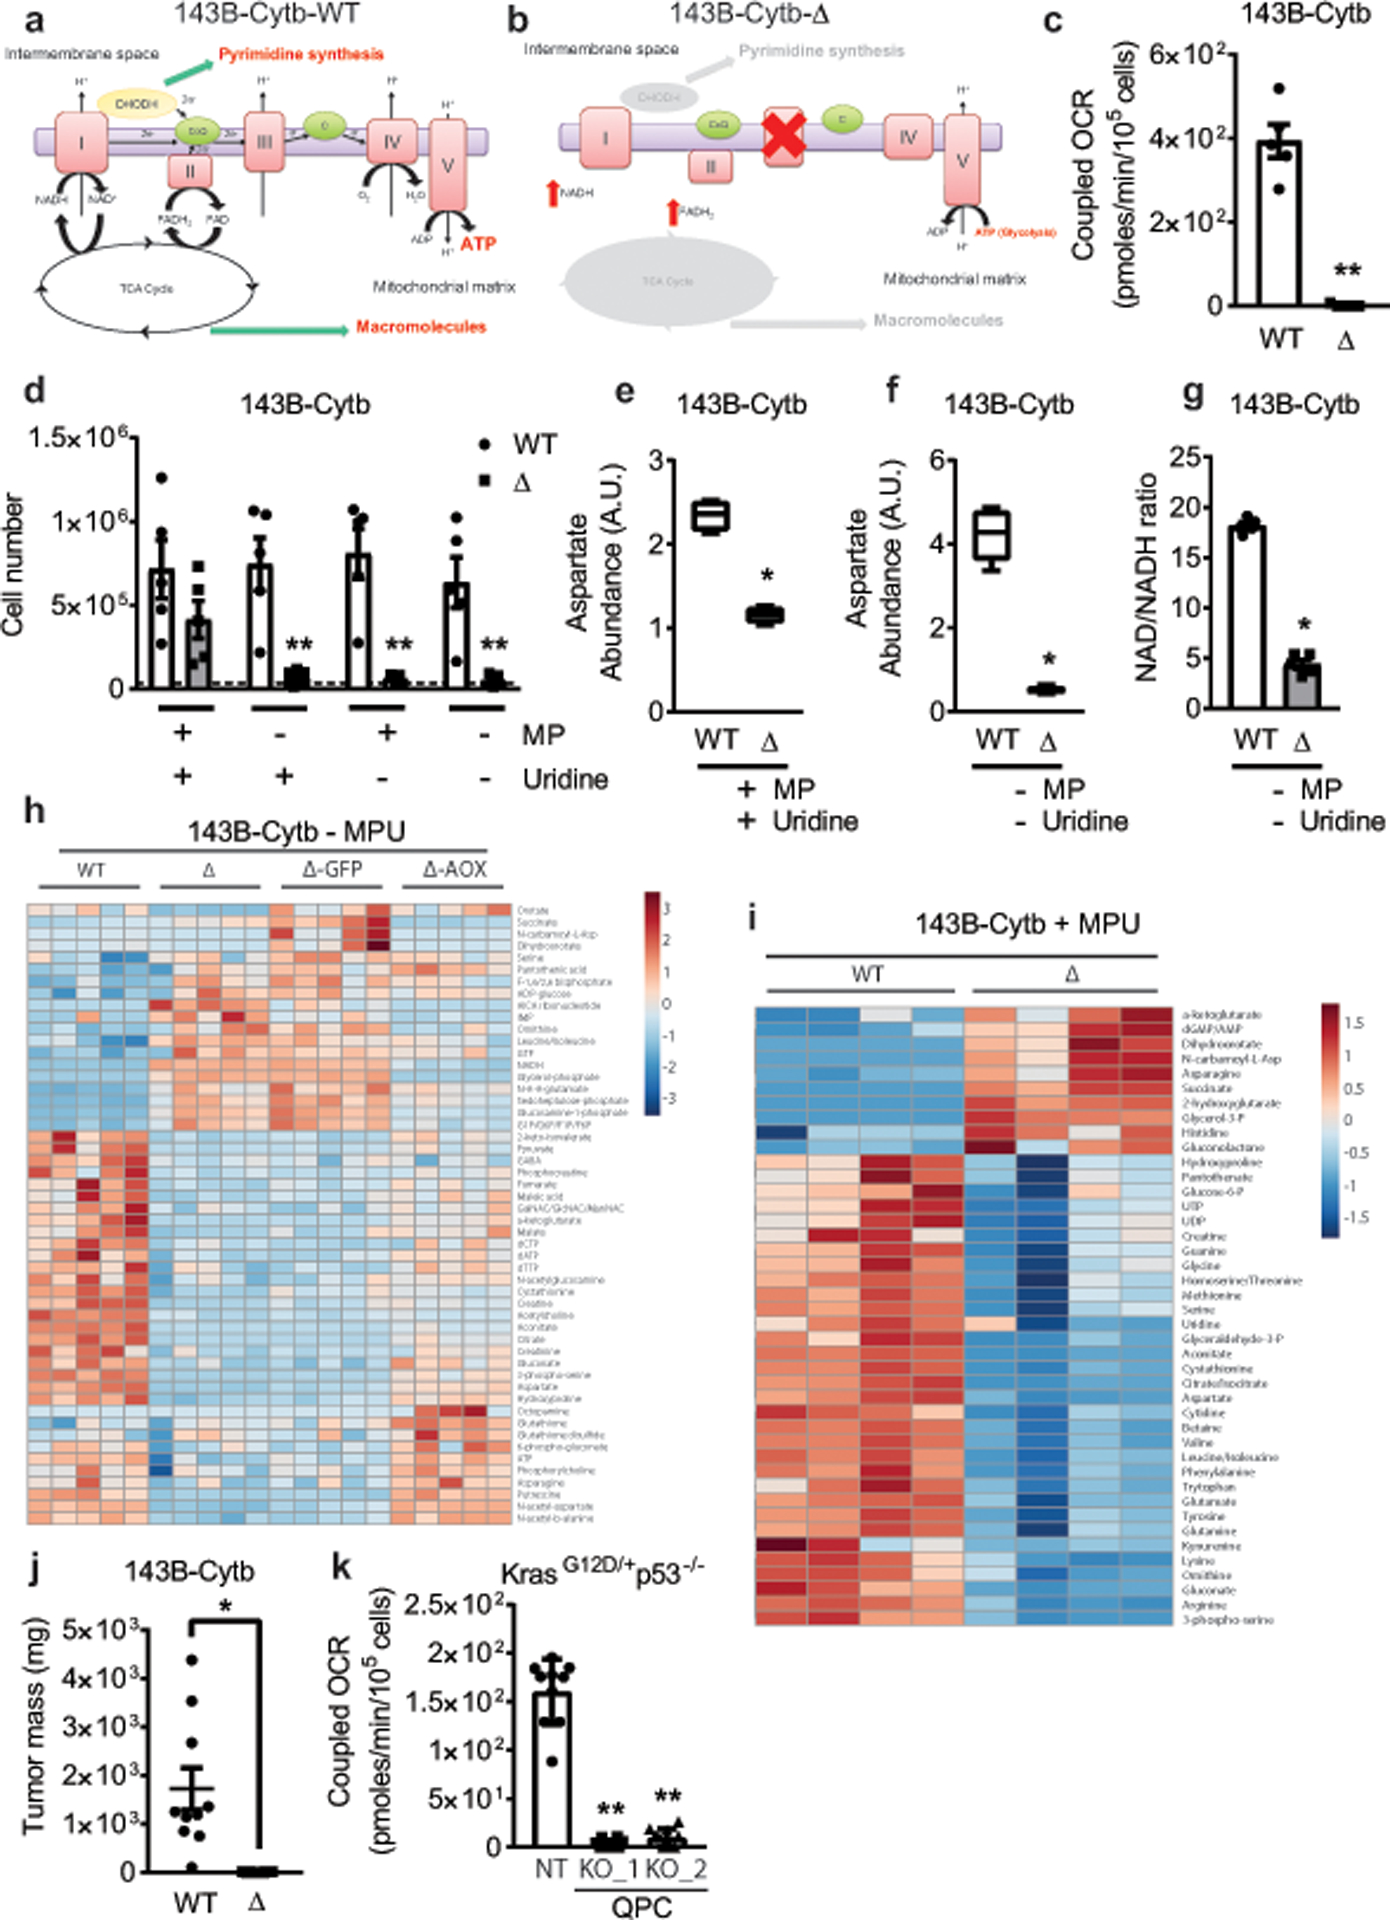
Extended Figure 1: Metabolite changes in complex III deficient cells in the presence or absence of pyruvate and uridine.

a,b, Schematic representation of the ETC in 143B-Cytb-WT (a) and 143B-Cytb-Δ cells (b). c, Coupled OCR of 143B-Cytb-WT and 143B-Cytb-Δ cells (n=5 biologically independent experiments). d, 143B-Cytb-WT and 143B-Cytb-Δ cells were grown in the presence or absence of methyl pyruvate and/or uridine and cell number was assessed after 72h (n=5 biologically independent experiments). e, Intracellular aspartate levels in the presence of methyl pyruvate and uridine in 143B-Cytb-WT and 143B-Cytb-Δ cells (n=4 biologically independent experiments). f, Intracellular aspartate levels in the absence of methyl pyruvate and uridine in 143B-Cytb-WT and 143B-Cytb-Δ cells (n=5 biologically independent experiments). g, Intracellular NAD+/NADH ratio in the absence of methyl pyruvate and uridine of 143B-Cytb-WT and 143B-Cytb-Δ cells (n=5 biologically independent experiments). h, The heat map displays the relative abundance of significantly changed metabolites in 143B-Cytb-WT, 143B-Cytb-Δ cells and in 143B-Cytb-Δ cells expressing either GFP or AOX in the absence of methyl pyruvate and uridine. A red-blue color scale depicts the abundance of the metabolites (Red: high, Blue: low), (n=5 biologically independent experiments). i, The heat map displays the relative abundance of significantly changed metabolites in 143B-Cytb-WT and 143B-Cytb-Δ cells in the presence of methyl pyruvate and uridine (n=4 biologically independent experiments). j, Tumor mass of xenografts from 143B-Cytb-WT and 143B-Cytb-Δ cells (n=10 mice per group from two independent cohorts). k, Coupled OCR of KP-NT and KP-QPC_KOs cells (n=10 technical replicates from two independent experiments). Data represent mean ± s.e.m. (c-g, j) or mean ± s.d. (k). Statistical significance was determined using two-tailed t-tests (c, g, j), 2-way ANOVA (d) with a Bonferroni test for multiple comparisons or 1-way ANOVA (k) with a Bonferroni test for multiple comparisons (*p < 0.05; **p < 0.01, exact P values in Source Data). Metabolites levels were analyzed with multiple one-way ANOVA using an FDR of 0.1 and Fisher’s least significant difference test post-hoc analyses Q=10%. For 2-group heatmap, t-tests with an FDR cutoff of 0.1 were used to identify significantly changed metabolites. Each row was analyzed individually. (*Q<.1, exact Q values in Source Data).
